Publications

2018 California Green Innovation Index
Tenth annual California Green Innovation Index finds that policies driving record-setting investment and innovation, but transportation emissions keep rising.
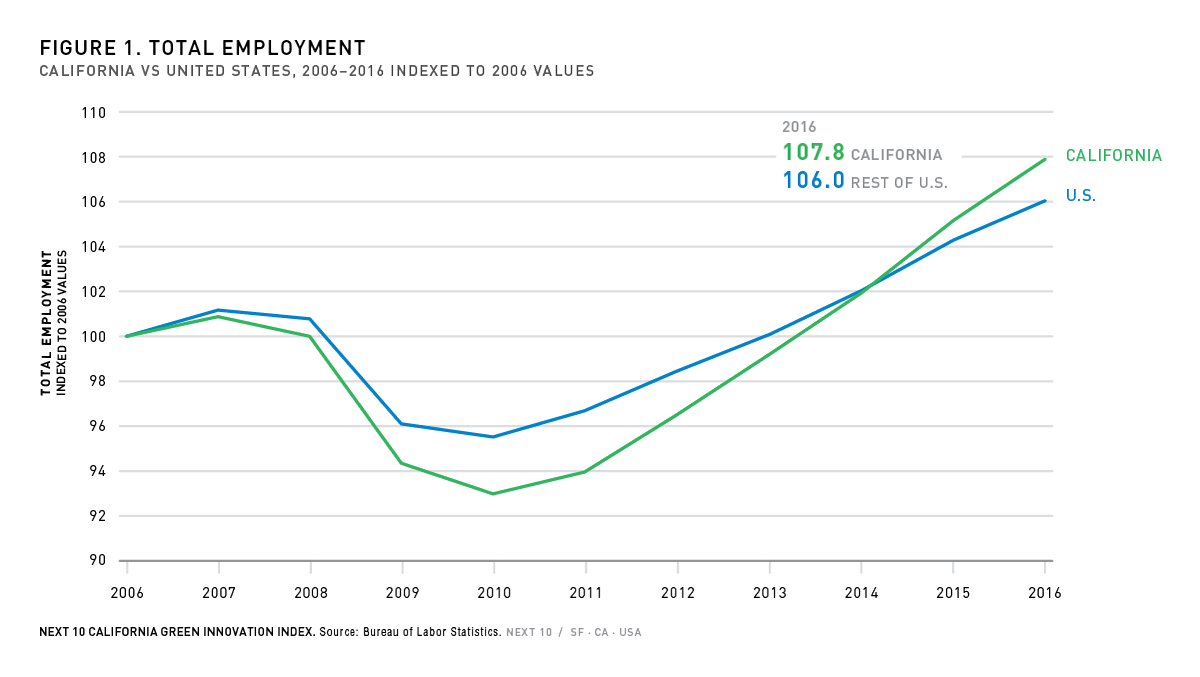
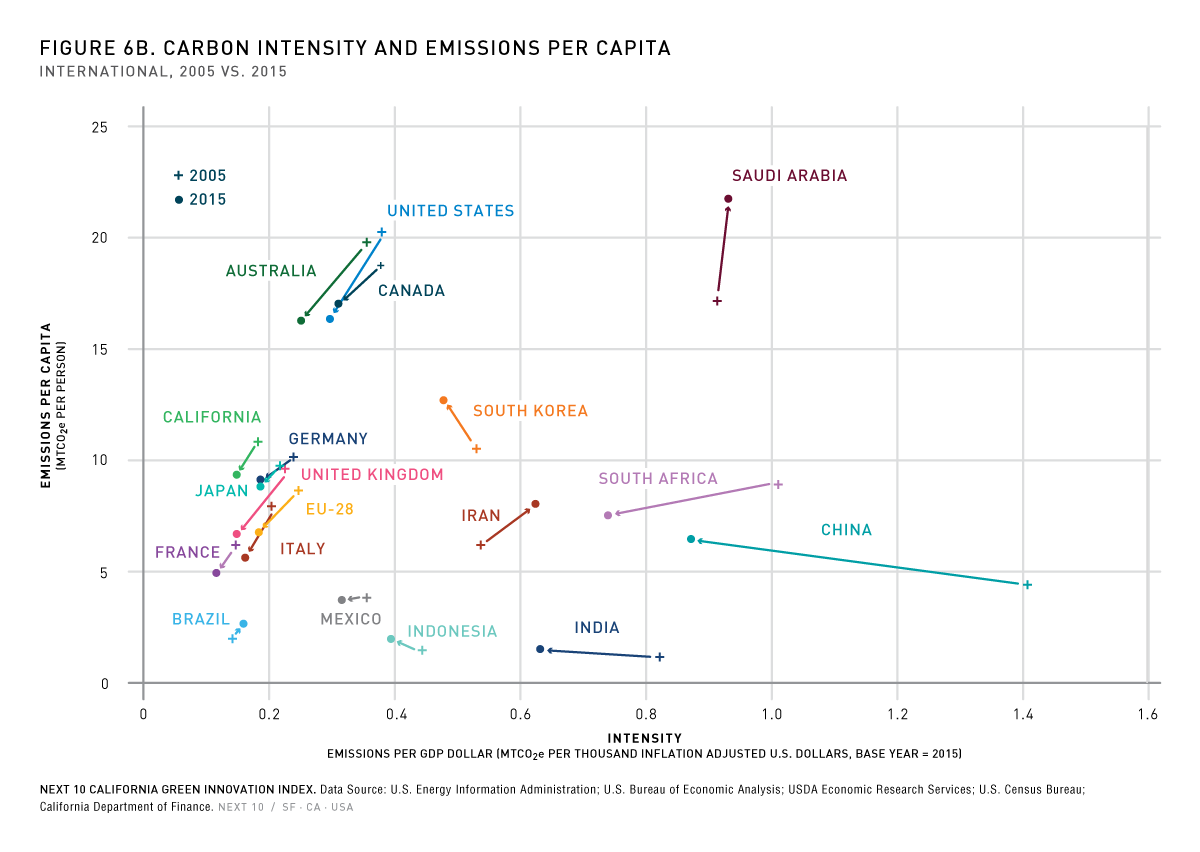
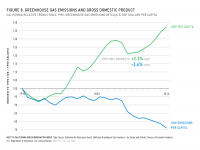
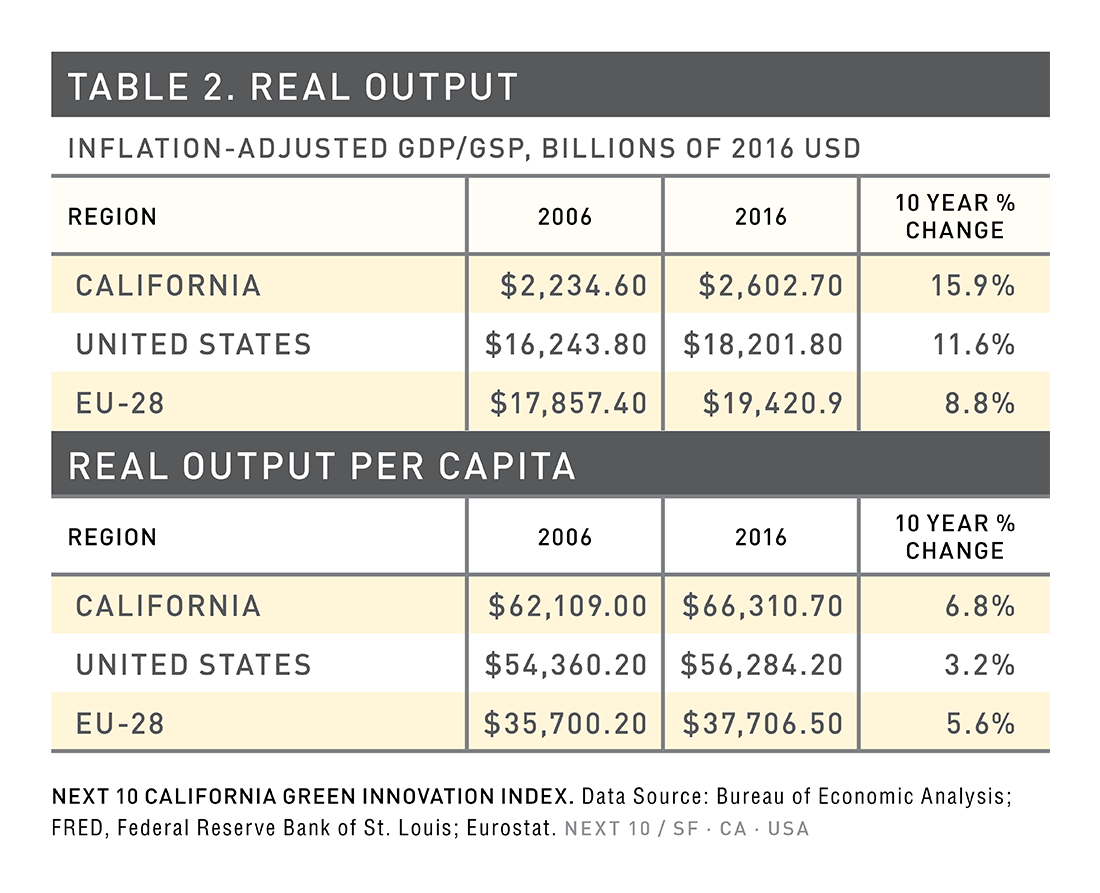
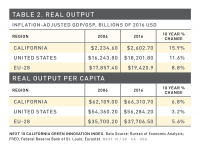
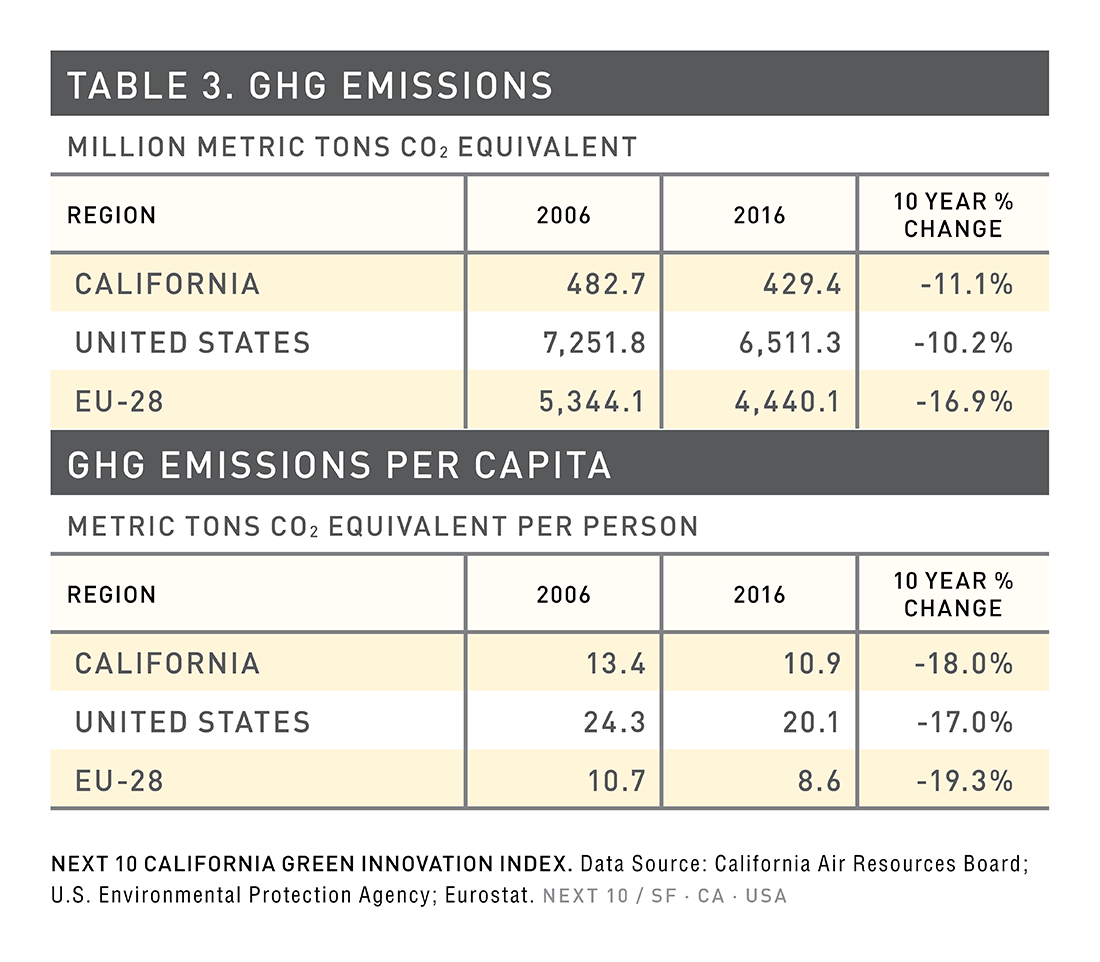
This year's California Green Innovation Index, released ahead of the Global Climate Action Summit, continues to compare state and environmental indicators with the U.S. and the rest of the world. The report finds that in the ten years since California passed its first climate law (AB 32), emissions fell by 11 percent, even as its economy grew by almost 16 percent during one of the longest economic expansions in the state's history. In comparison, the U.S. economy grew by 11.6 percent while emissions decreased by 10.6 percent. The European Union (EU-28) was the only major economy to cut emissions more than California, but it's real economic output grew by only 8.8 percent.
The data also show a formidable challenge when it comes to reducing emissions from the transportation sector. Cars are getting cleaner in California, but transportation emissions still increased in 2016 because there were more cars on the road and more miles driven. California has been building a strong industry around transportation that could command the worldwide transportation market, but federal challenges to California's authority to set vehicle emission standards pose both an emissions and economic risk.
Next 10 owns the rights to this publication. Any usage of content from this publication is subject to our Terms of Use.


Carbon Economy
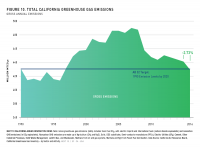
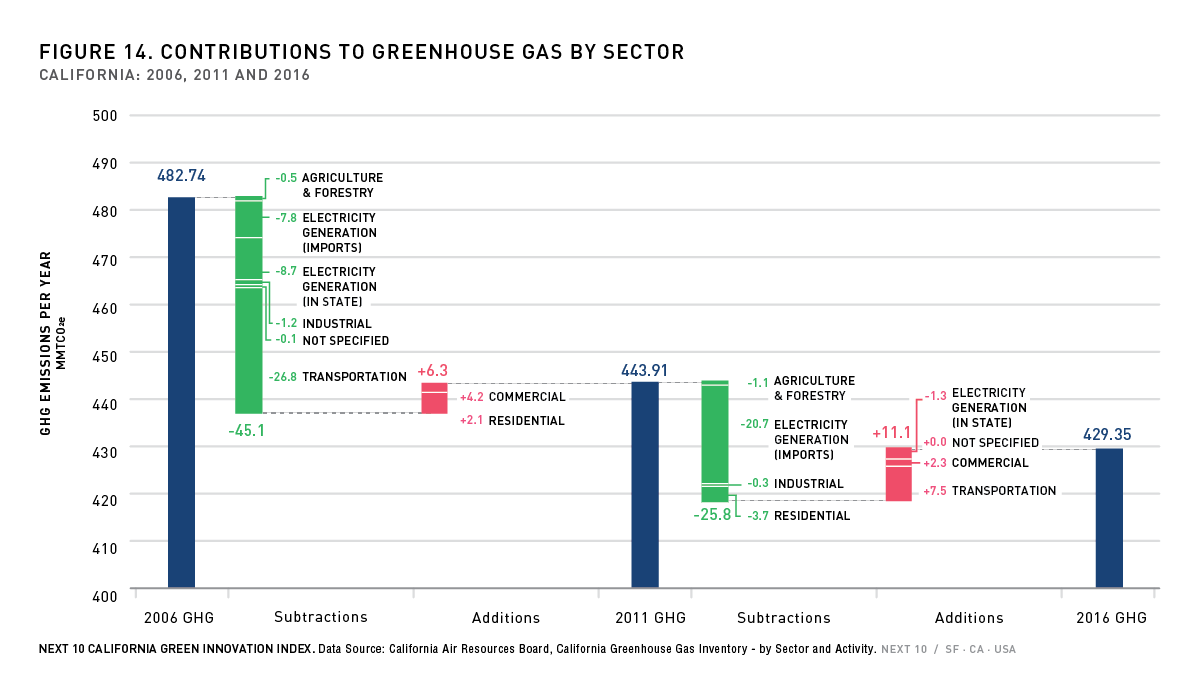
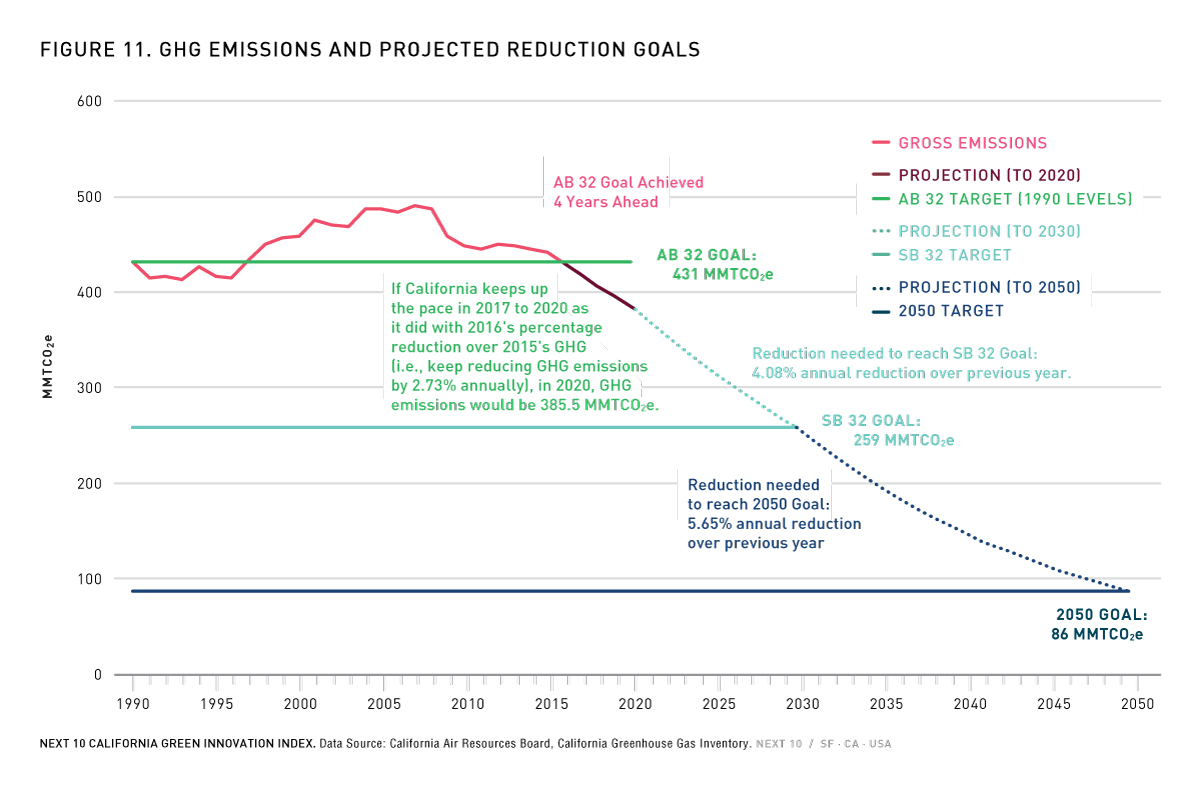
- Between 2015 and 2016, California’s total GHG emissions fell 2.7 percent, primarily due to electricity generation GHG reductions. California will have to achieve just over 4 percent annual declines between 2020 and 2030 in order to achieve the state's 2030 emissions goal.
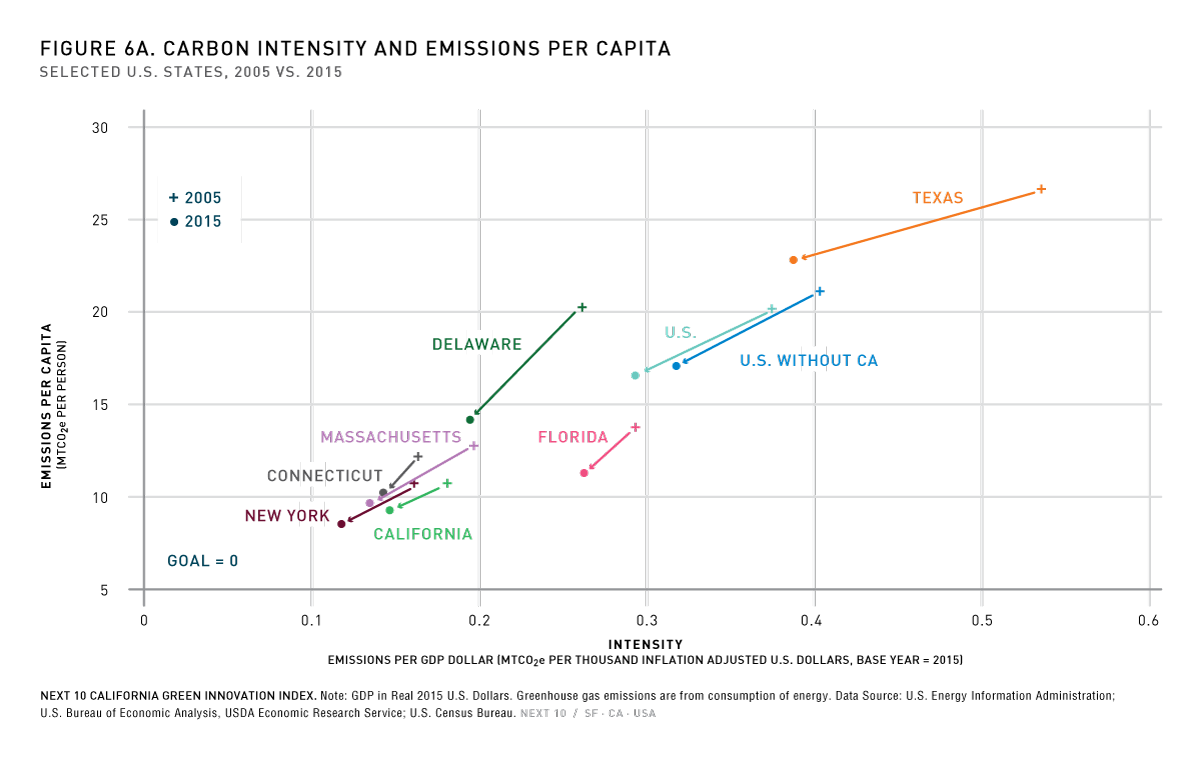
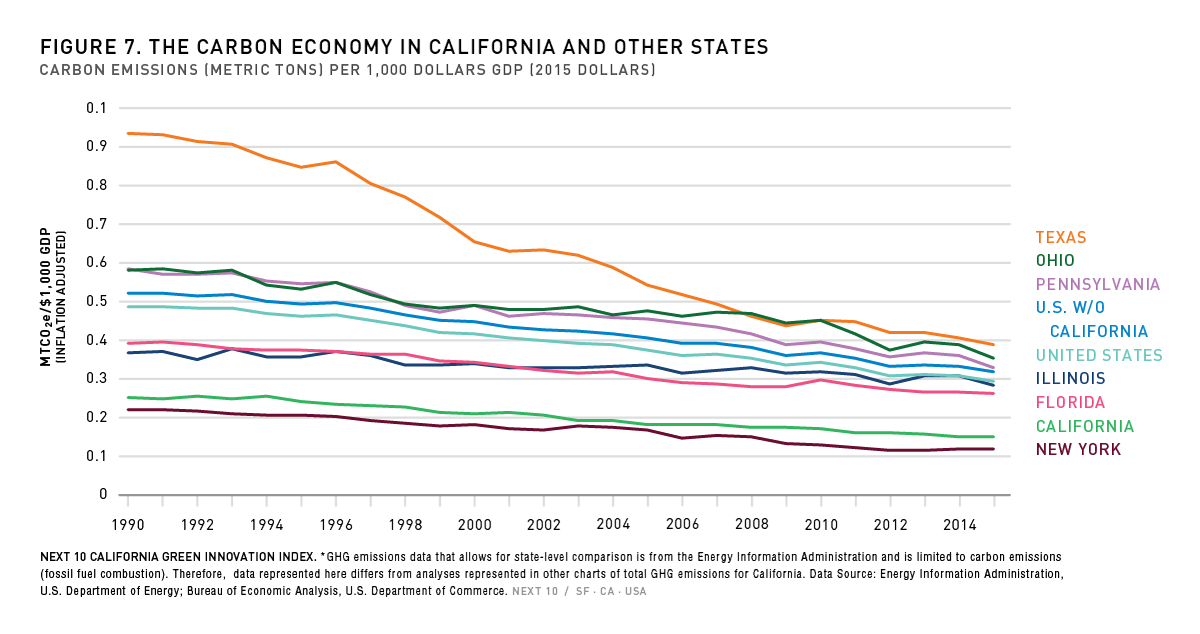
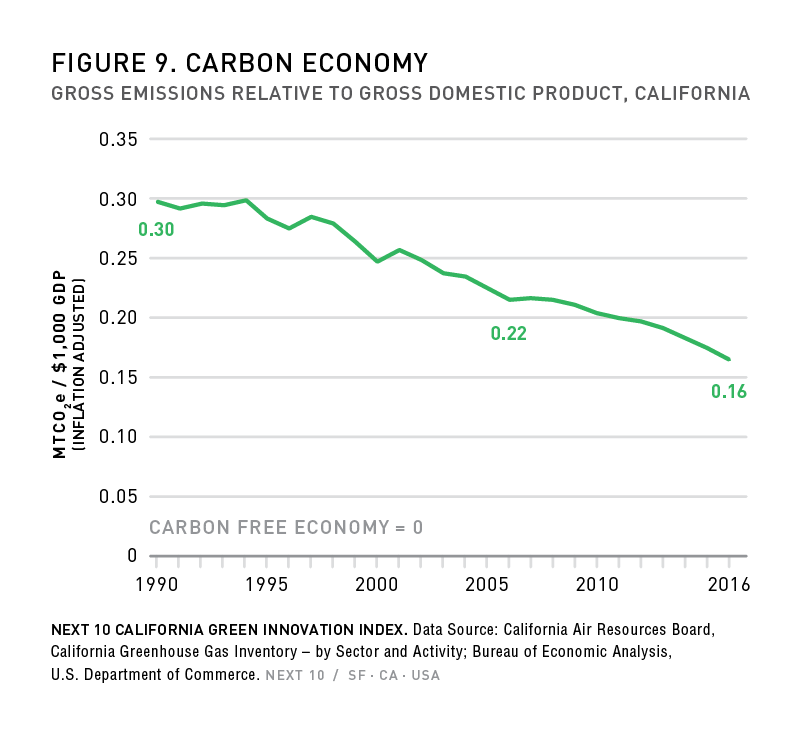
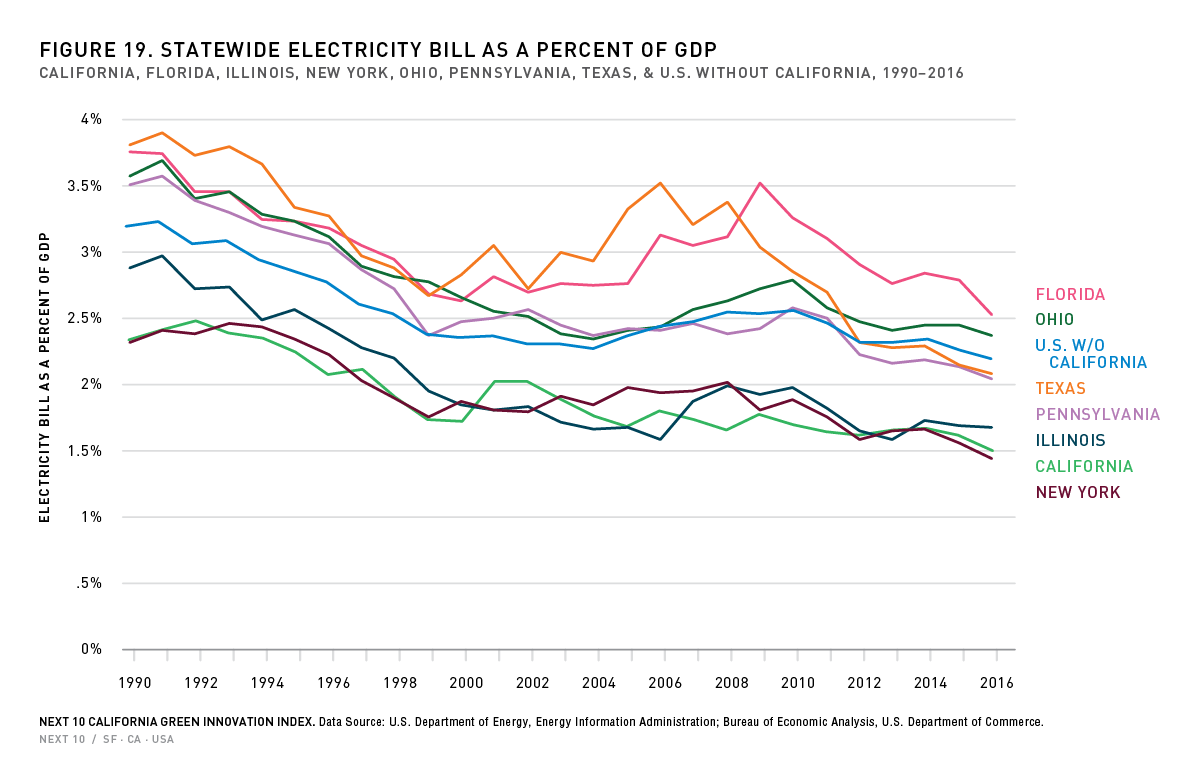
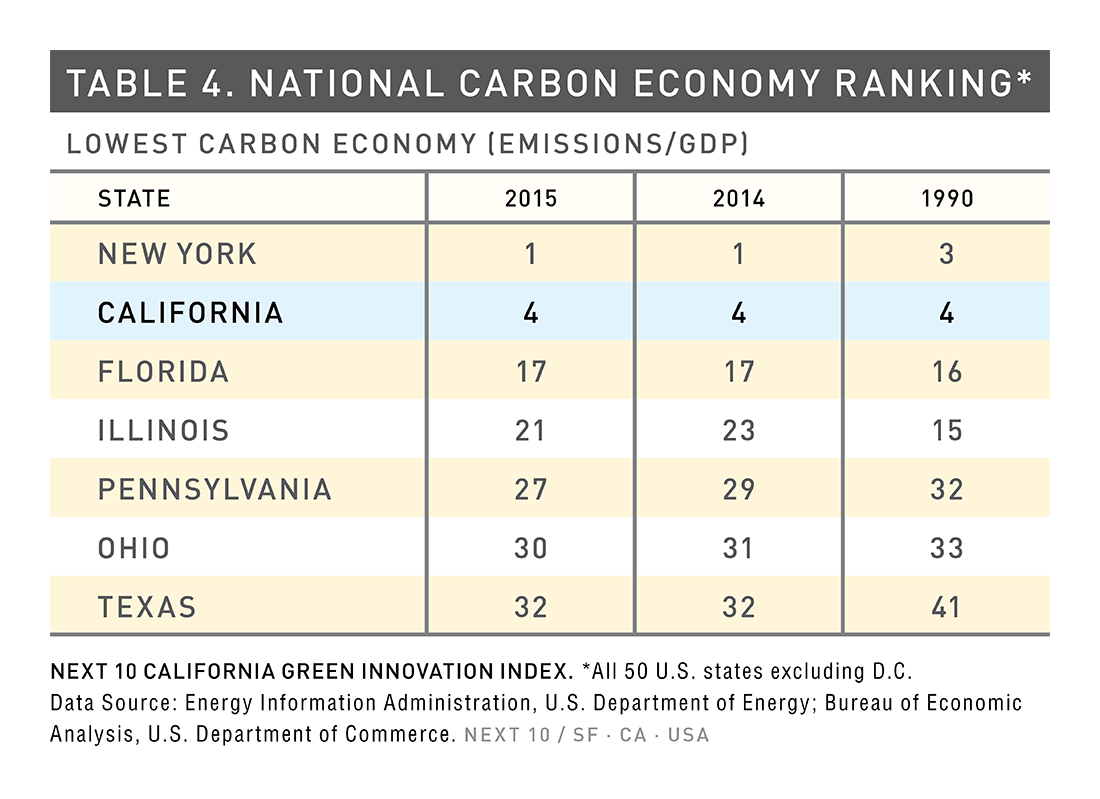
- The carbon intensity (emissions relative to GDP) of the California economy continues to decline, with emissions of 0.165 MTCO2e per $1,000 of GDP generated in 2016, a 5.5 percent improvement compared to 2015 and a 23.6 percent improvement over 2006.
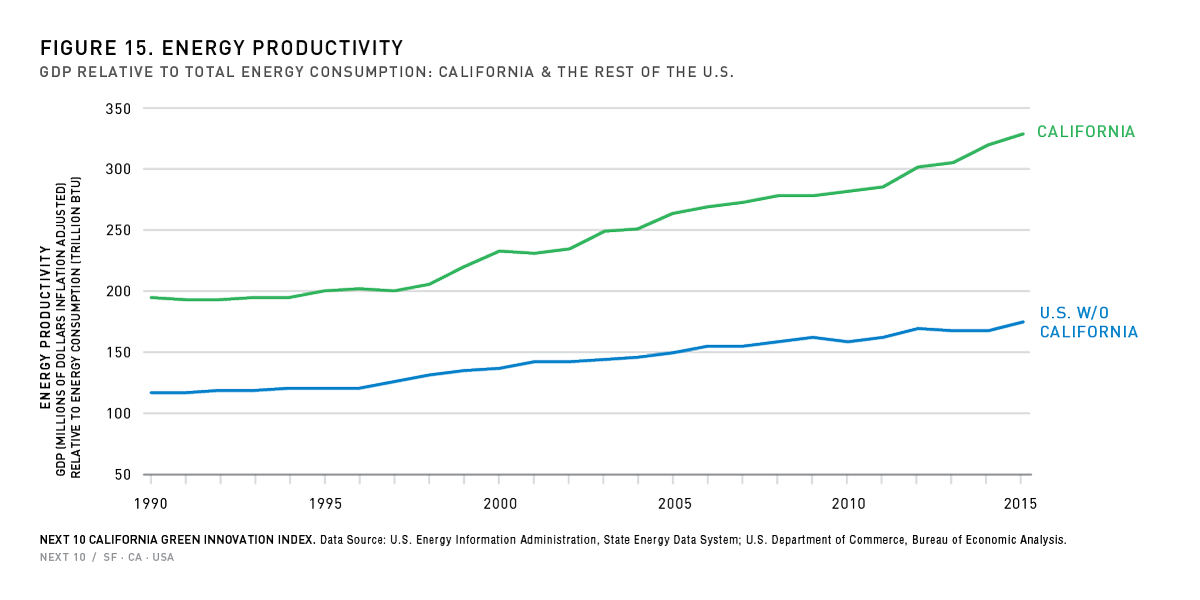
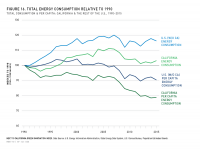
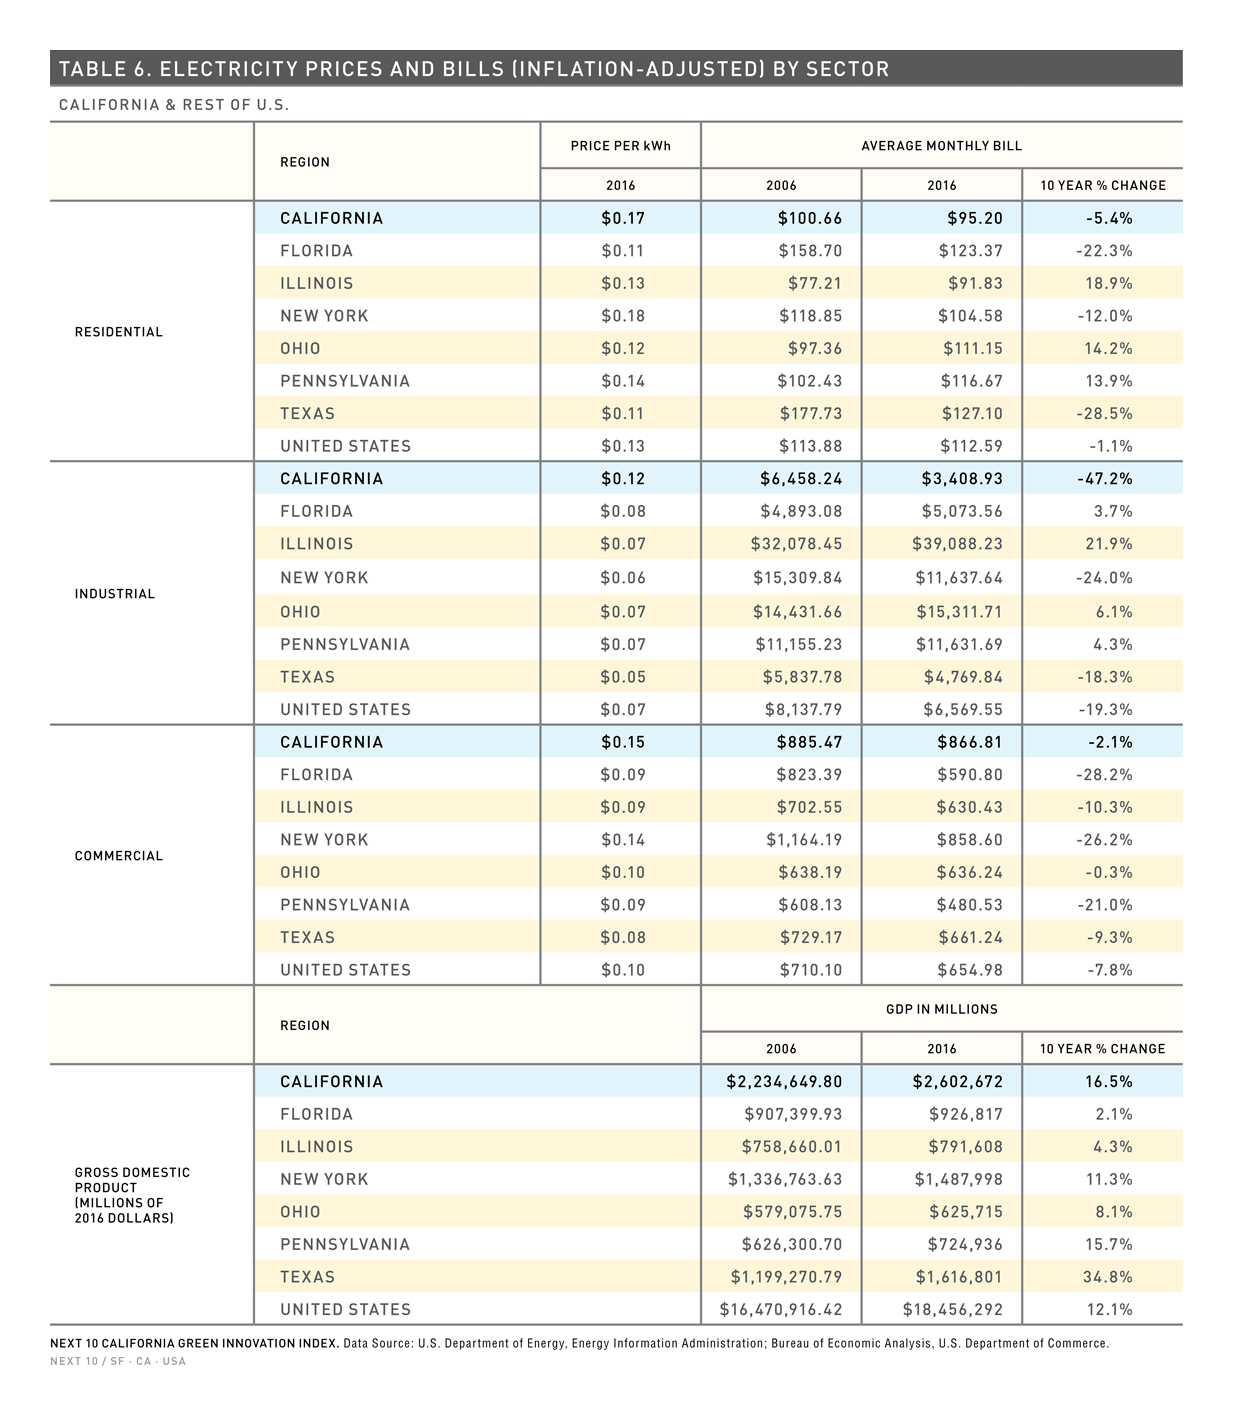
- In 2015, California generated $3.29 of GDP for every 10,000 British Thermal Units of energy consumed, while the rest of the U.S. generated $1.75 of economic output for the same amount of energy consumed.
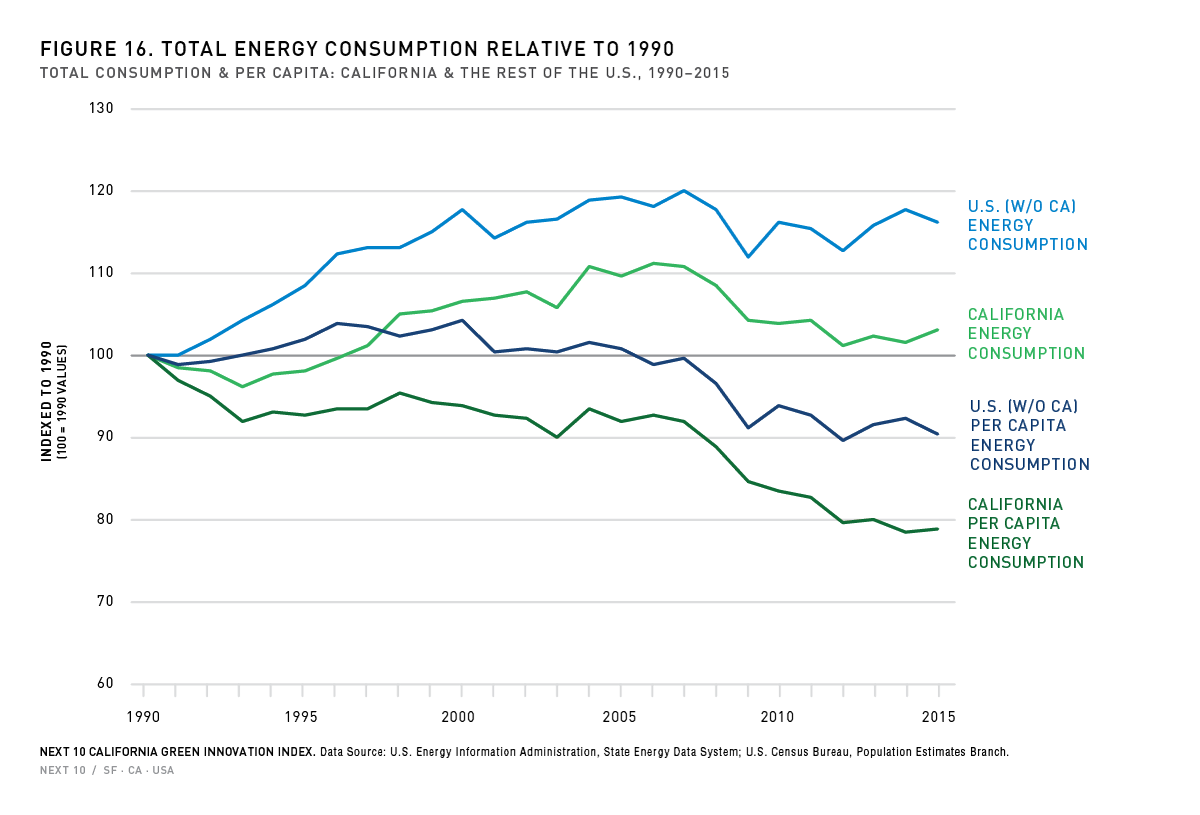
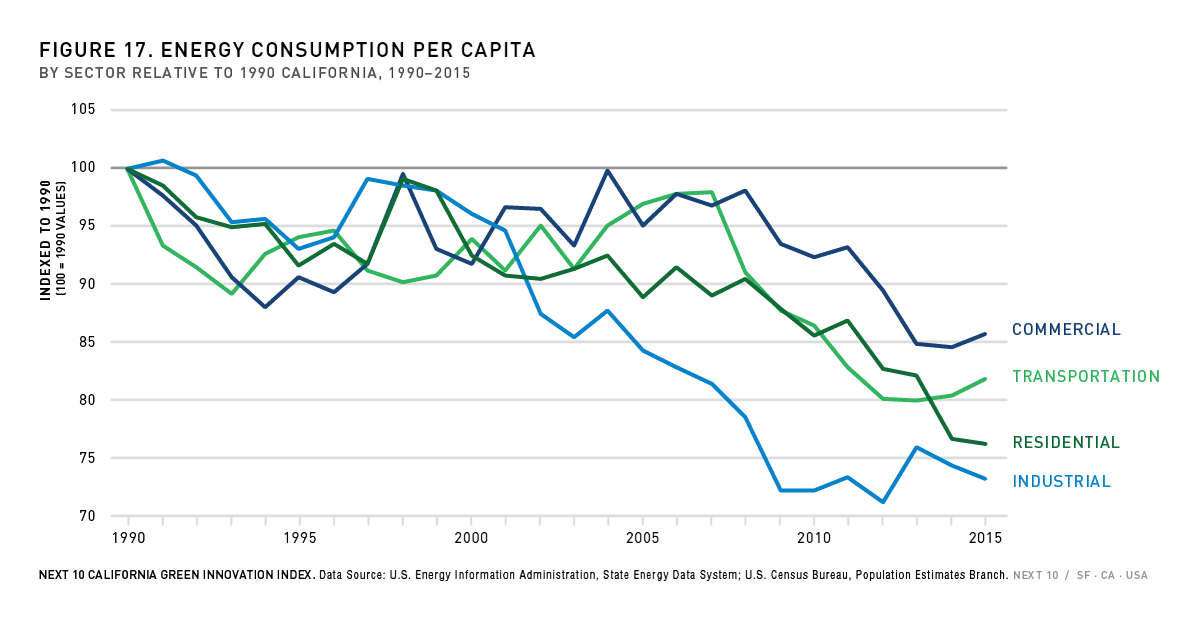
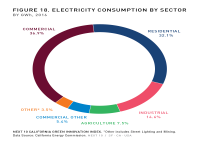
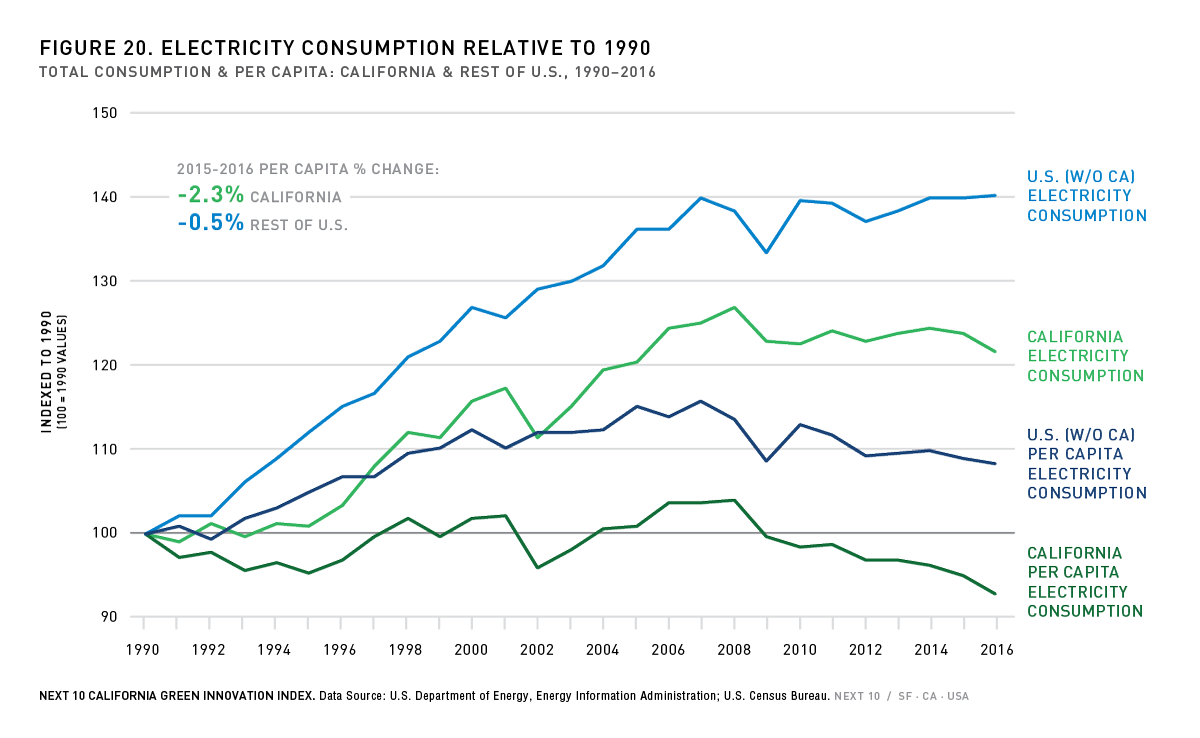
- Per capita electricity consumption decreased 14.1 percent between 2005-2015 in California, and 21.2 percent since 1990, despite the proliferation of electronic devices.
Clean Technology Innovation
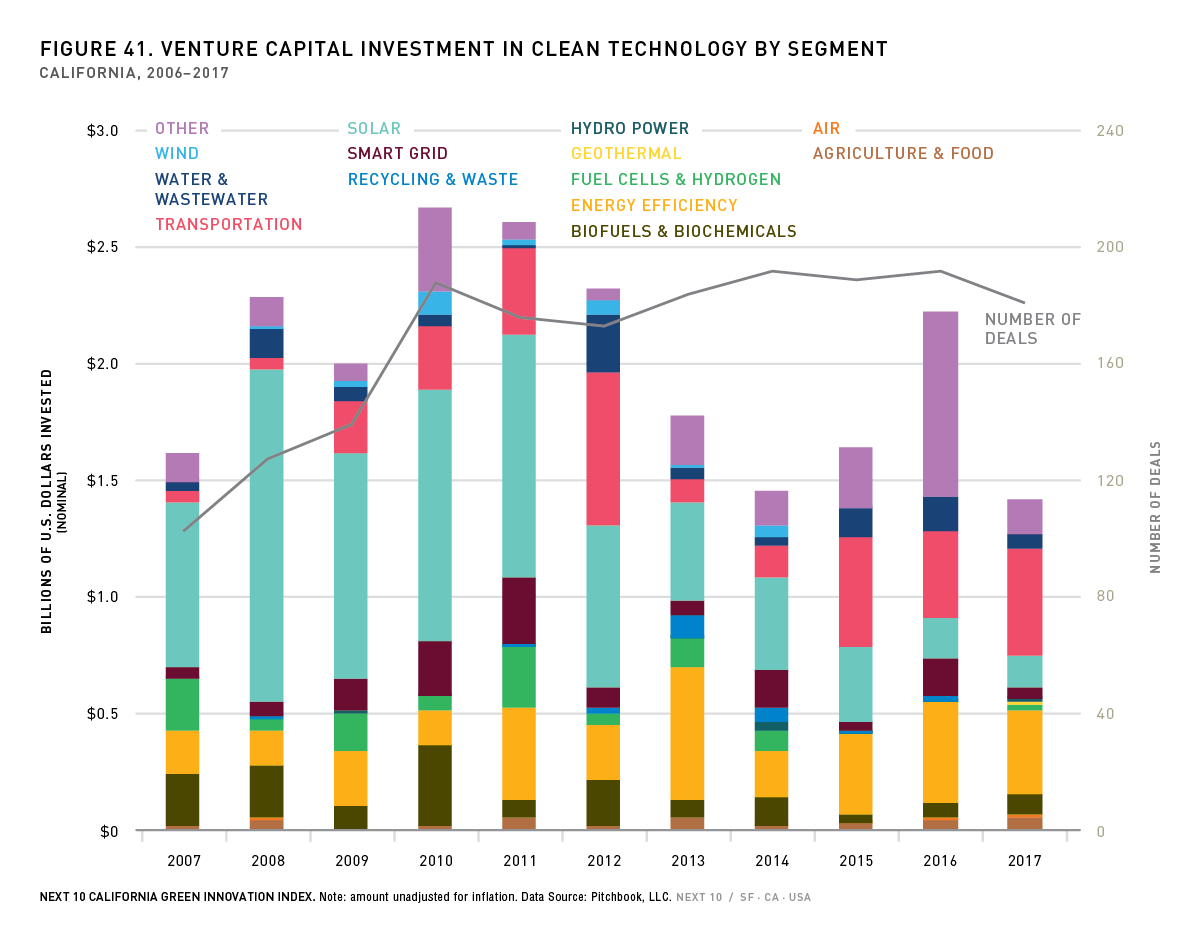
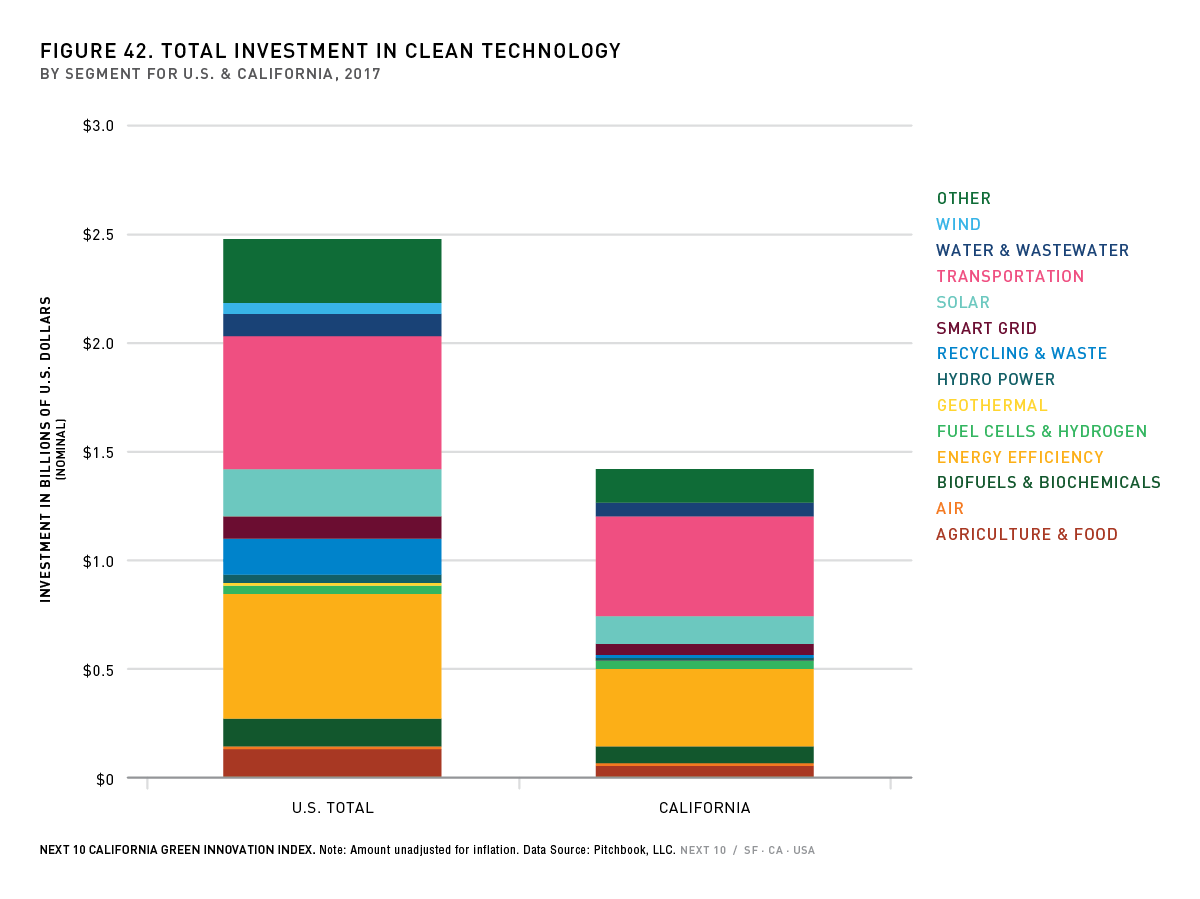
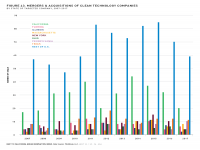
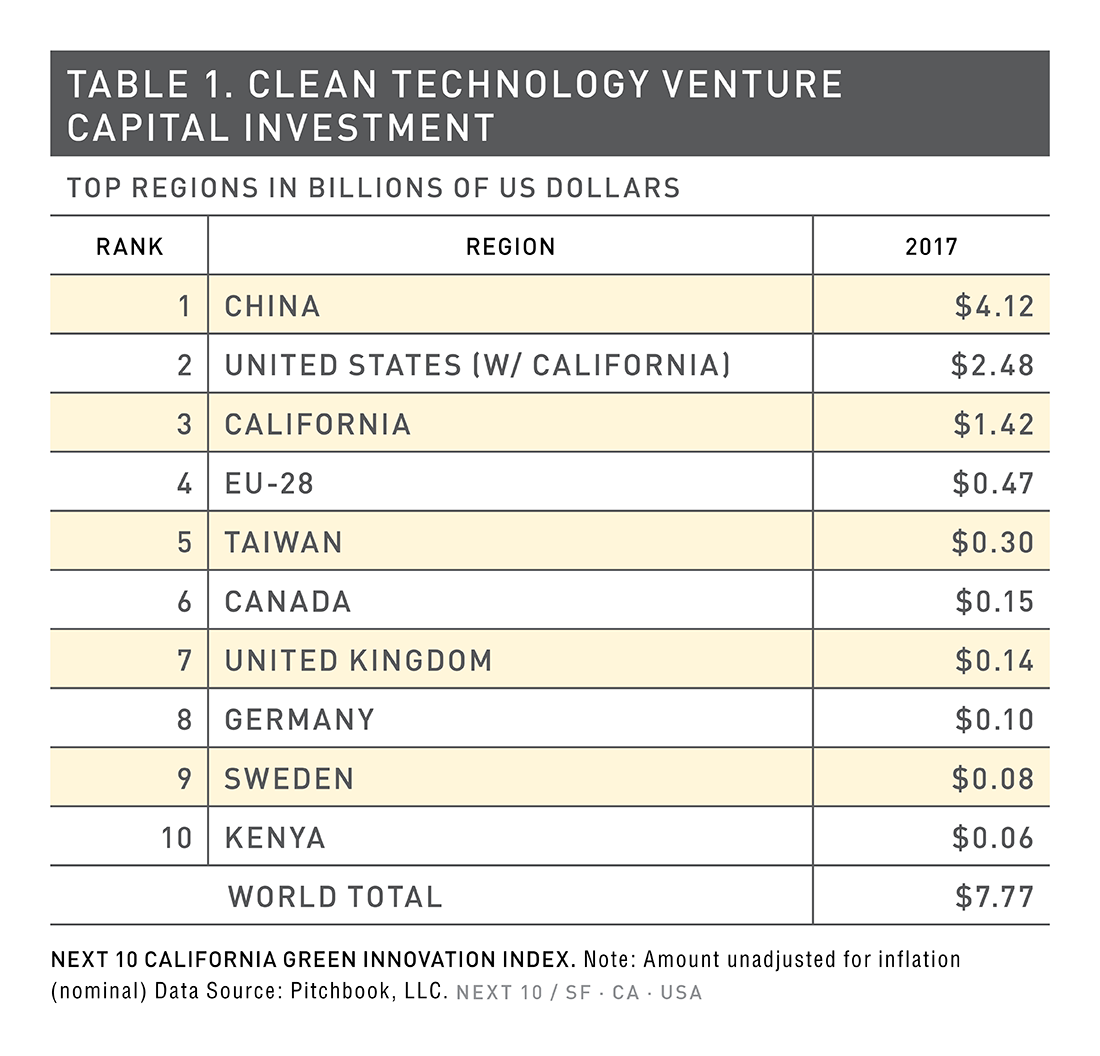
- California has generated more than $22 billion in clean technology venture capital investment from 2007 to 2017 and is third only to the U.S. as a whole and China.
- In 2017, $2.5 billion was invested in clean energy technology in the United States, with 57.2 percent ($1.4 billion) going to California companies.
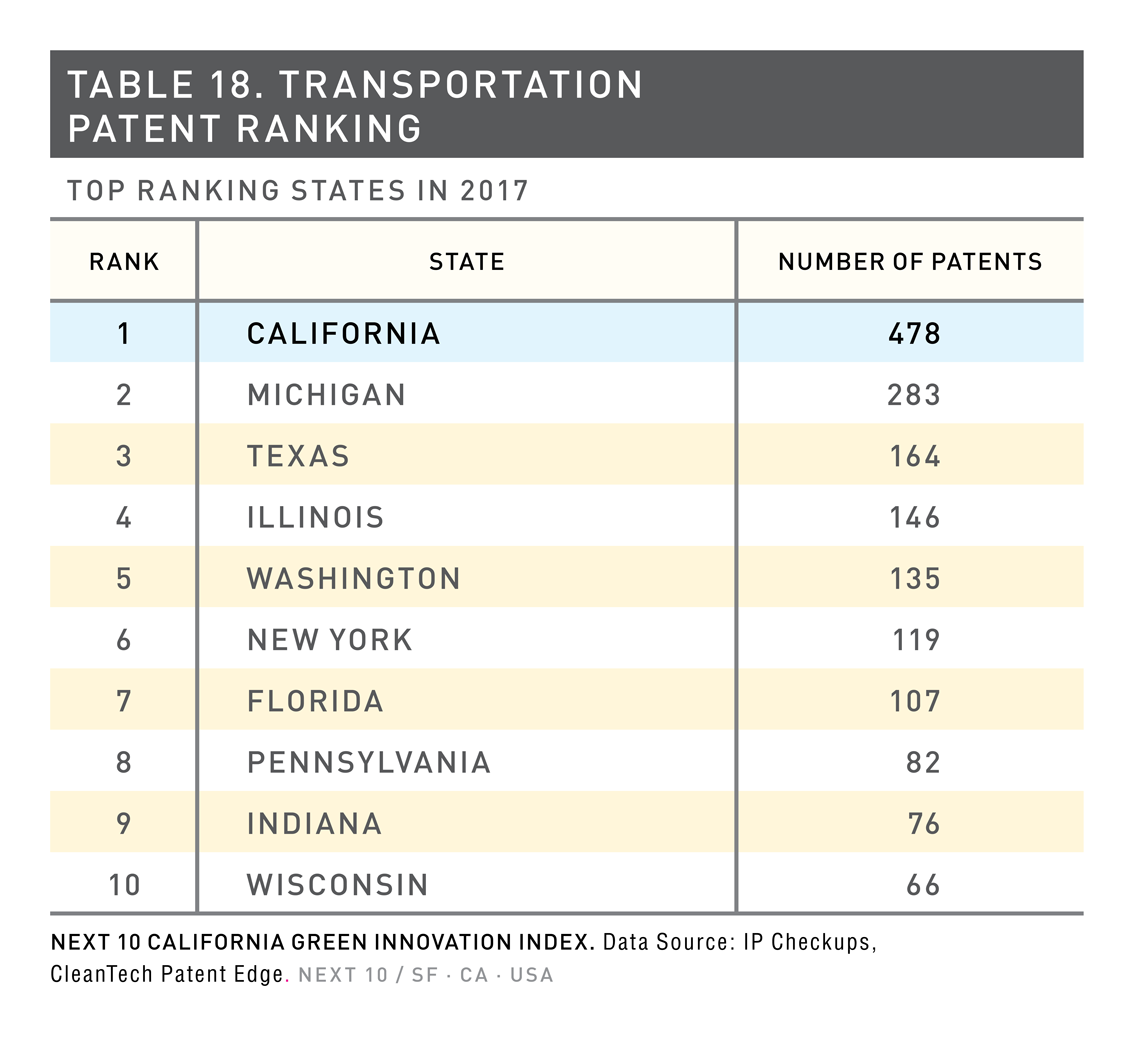
- Transportation technologies received the largest share ($610 million in the U.S.; $459 million of which went to California).
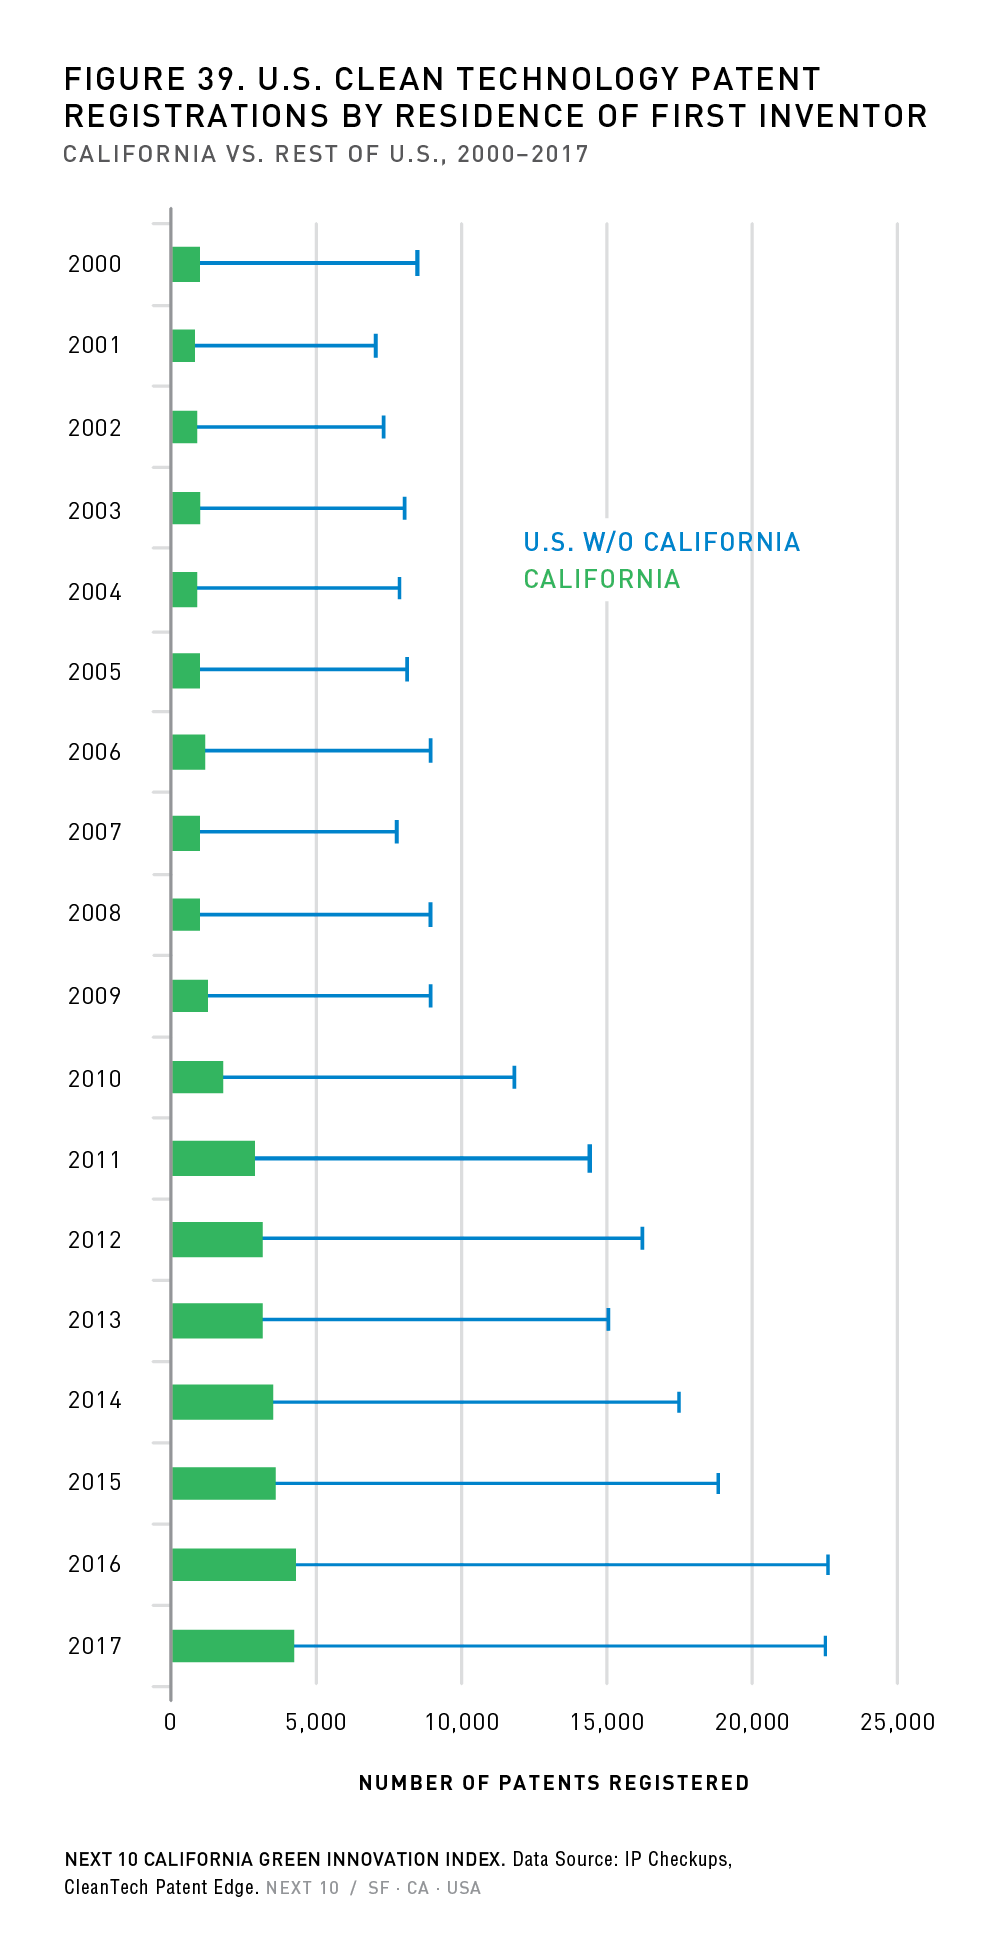
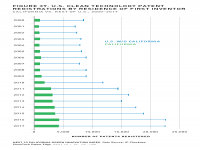
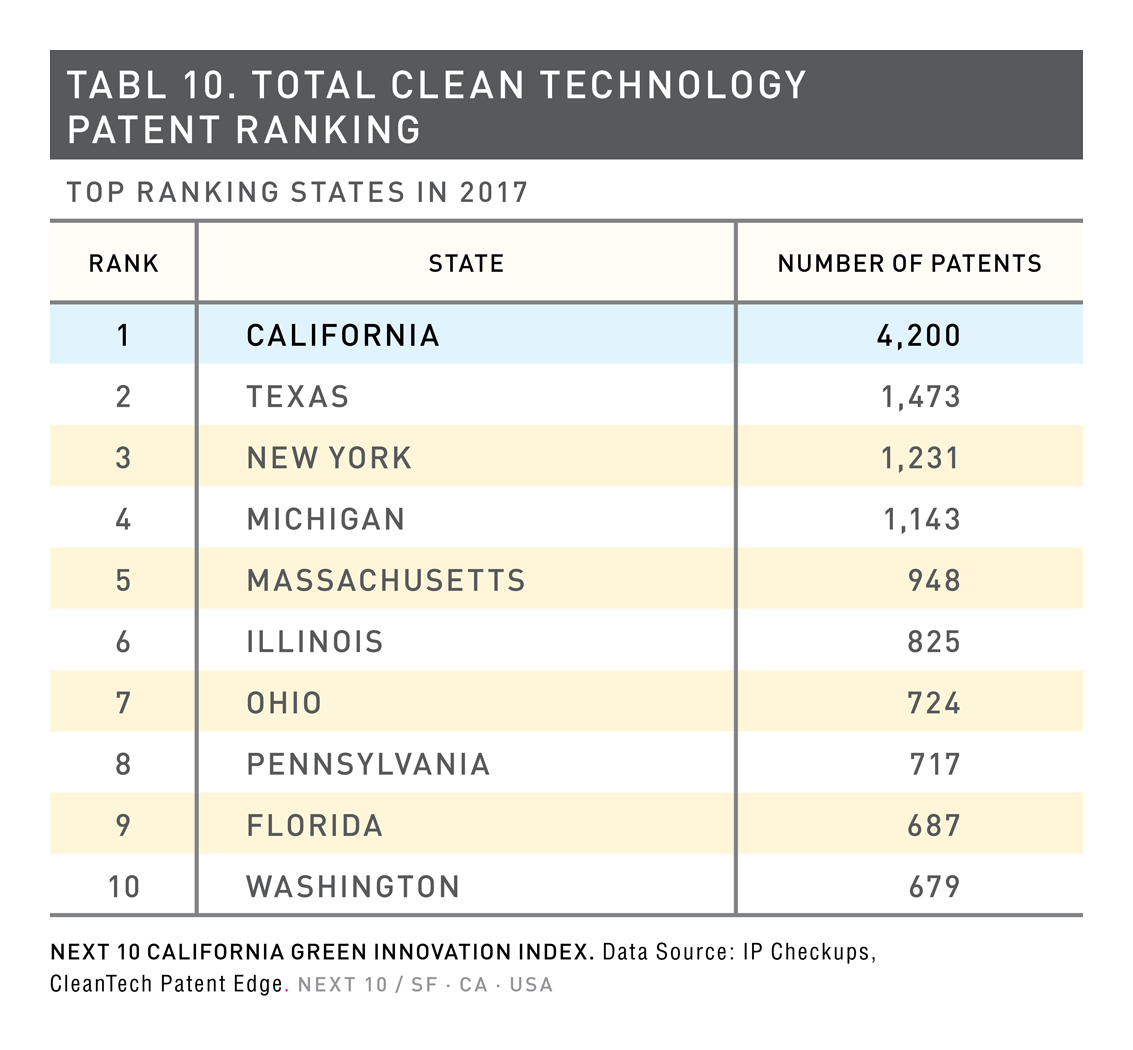
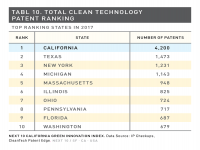
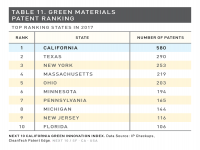
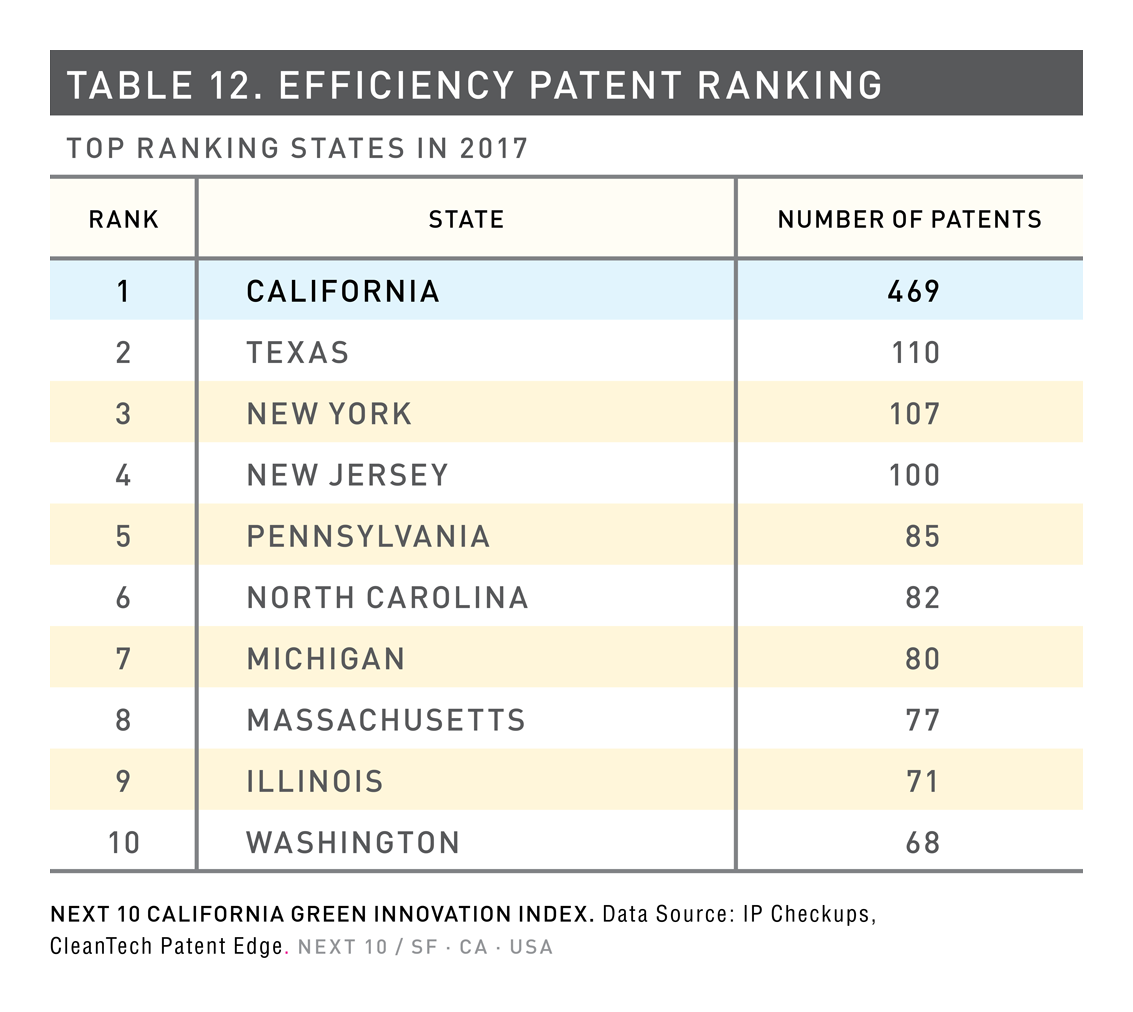
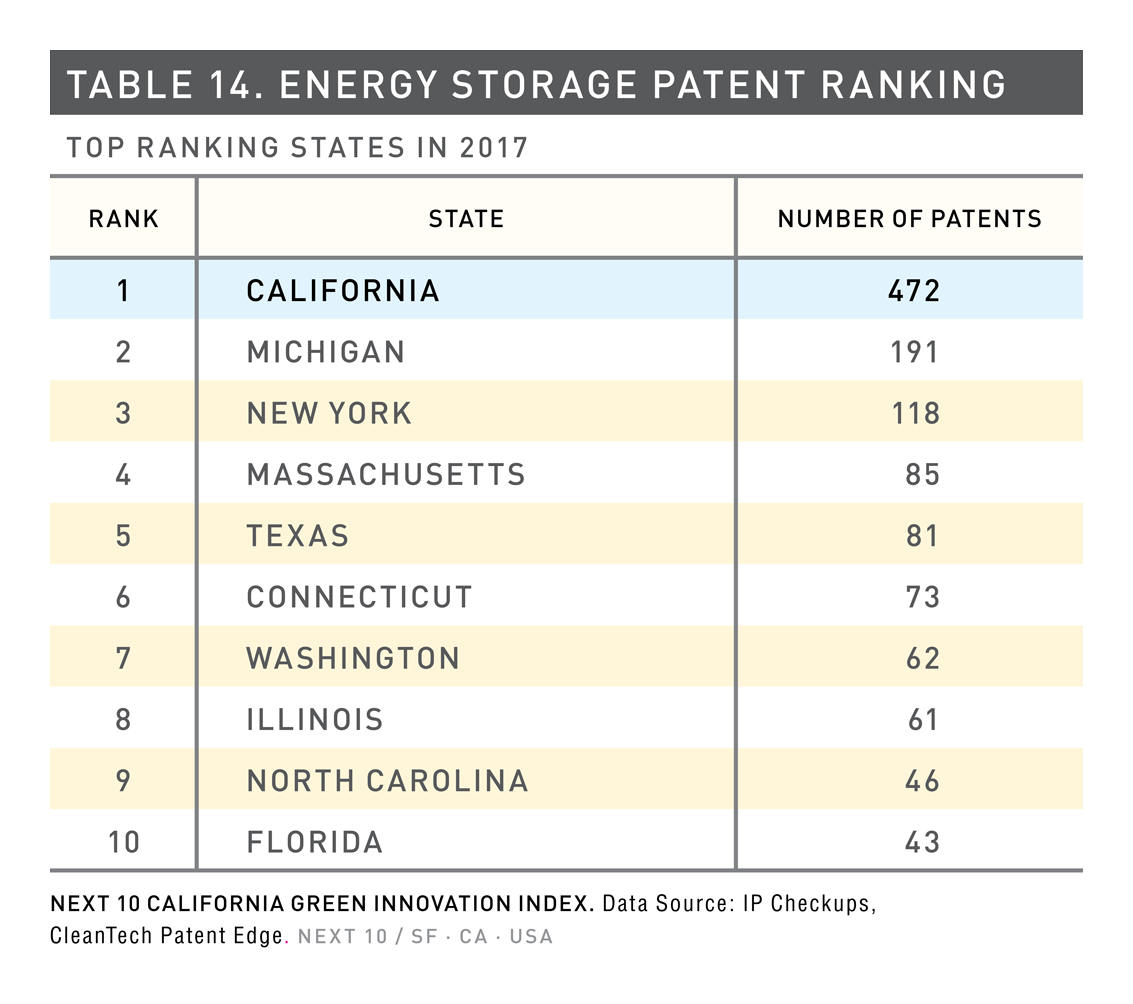
- California and the U.S. saw a decline in patents from 2016 to 2017, while the world saw an 11.2 percent gain.
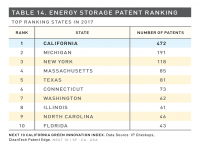
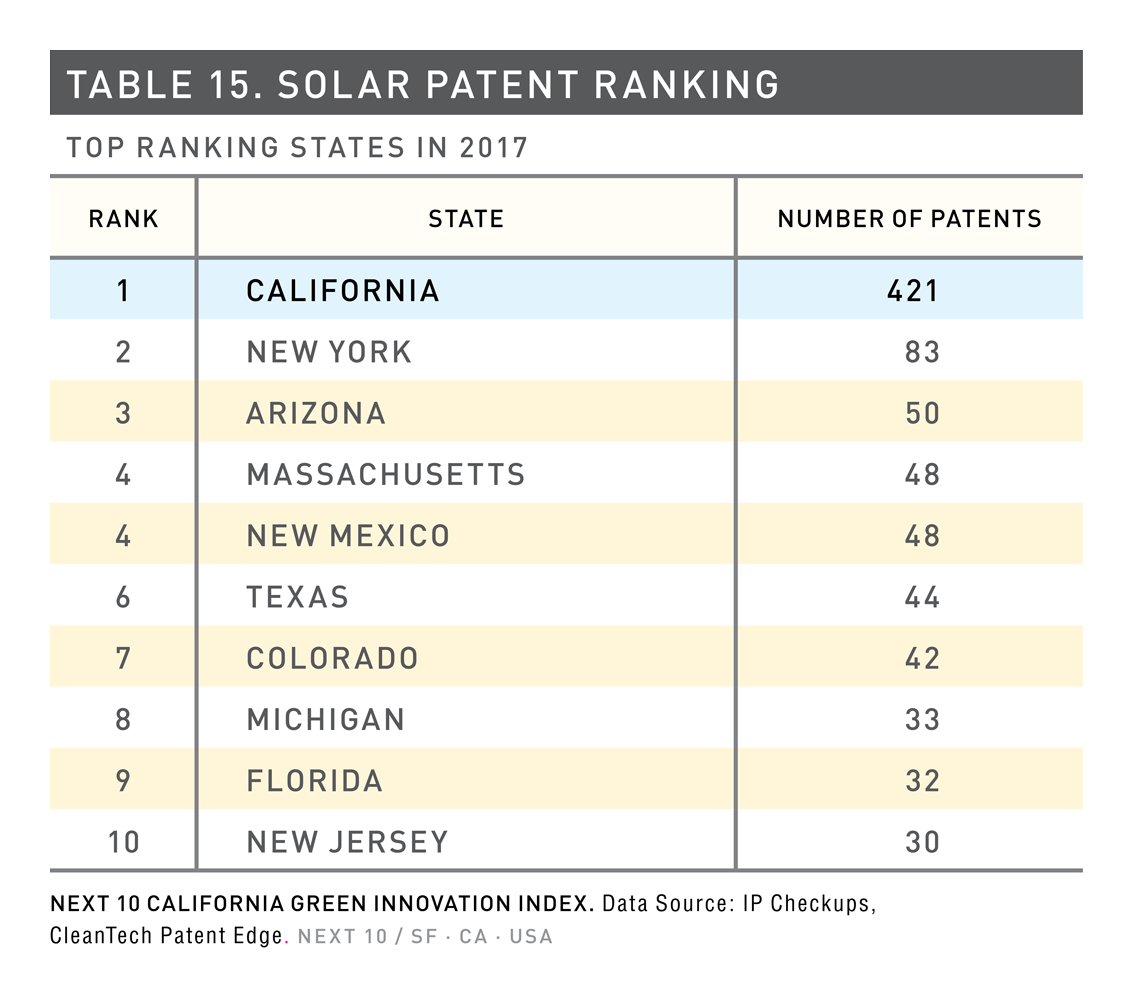
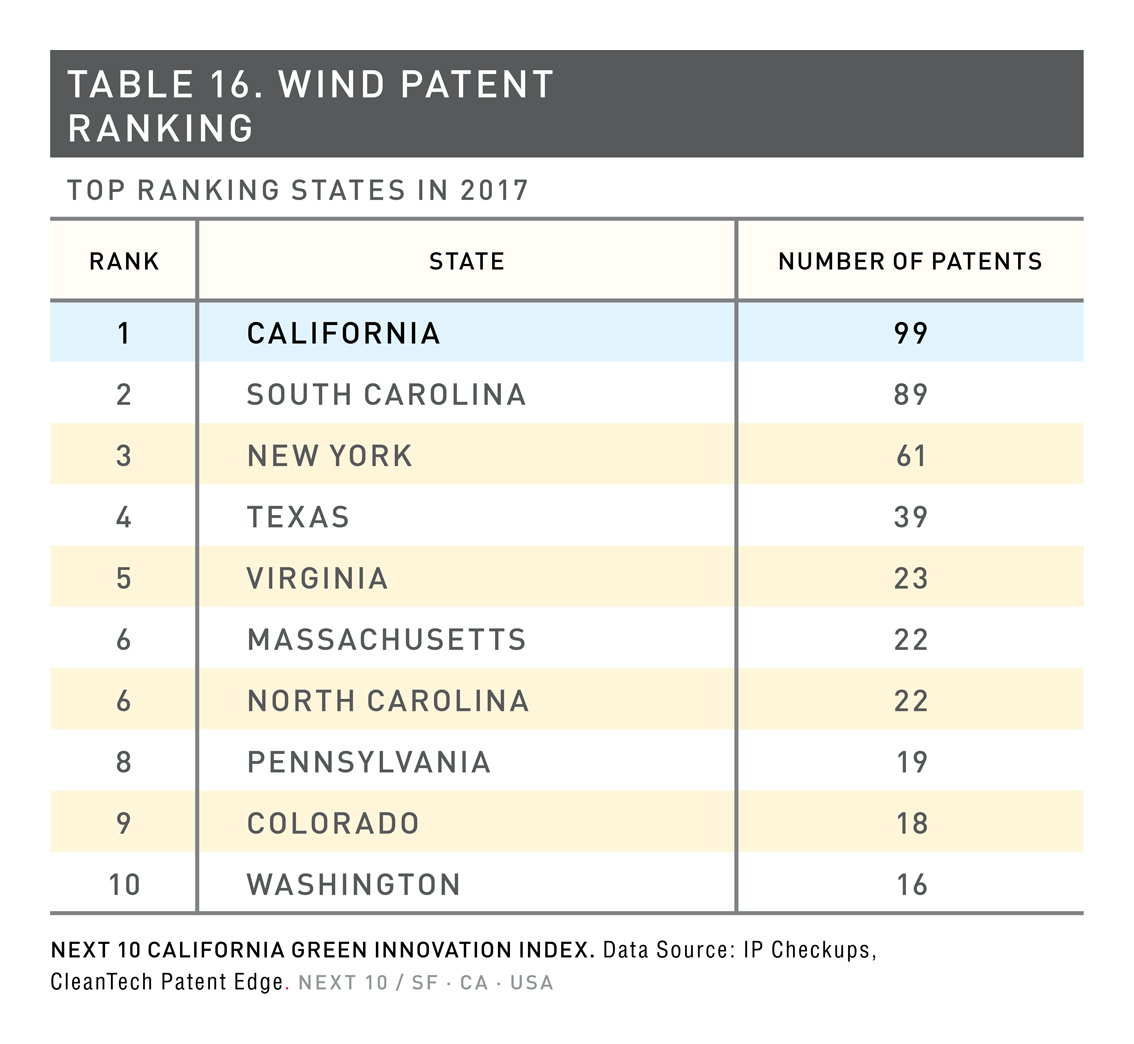
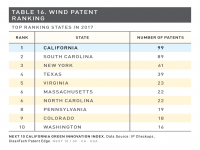
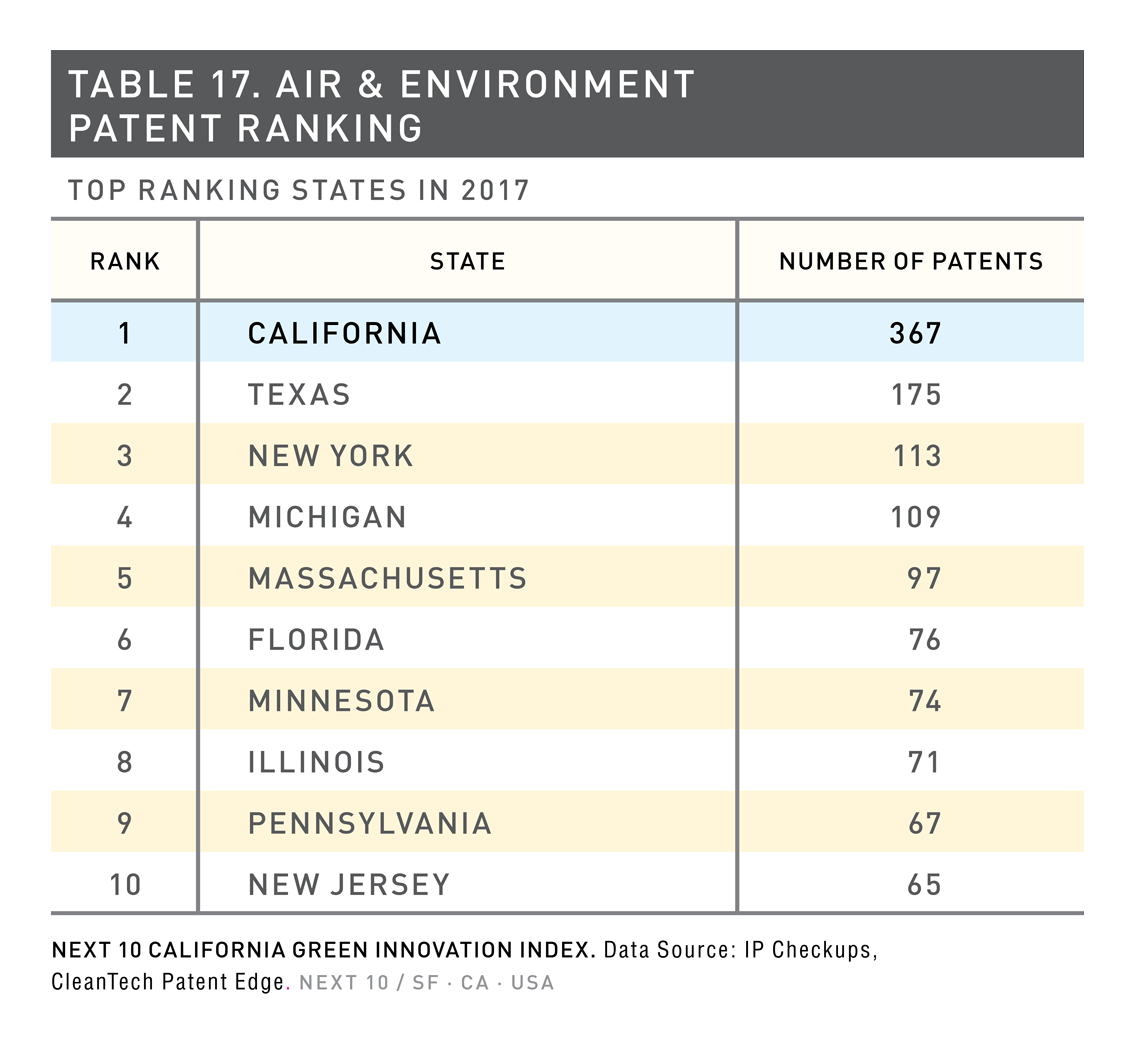
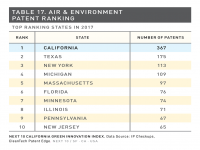
- California produced more than 5 percent of the world’s clean tech patents in 2017, making it the fifth largest global contributor, while the U.S. had 24 percent, not including California.
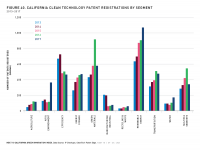
- Globally, the the number of clean technology patents increased 243.8 percent between 2007 and 2017, and by 342 percent in California.
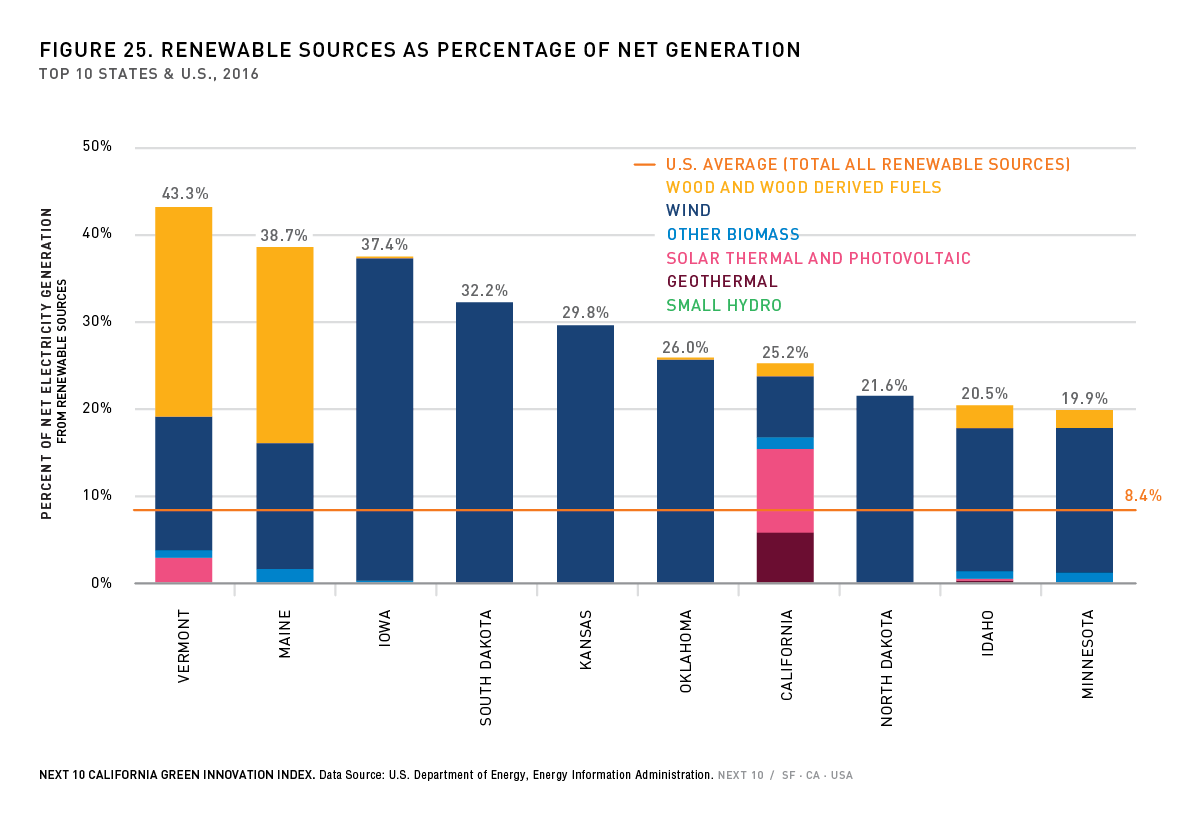
Renewable Energy
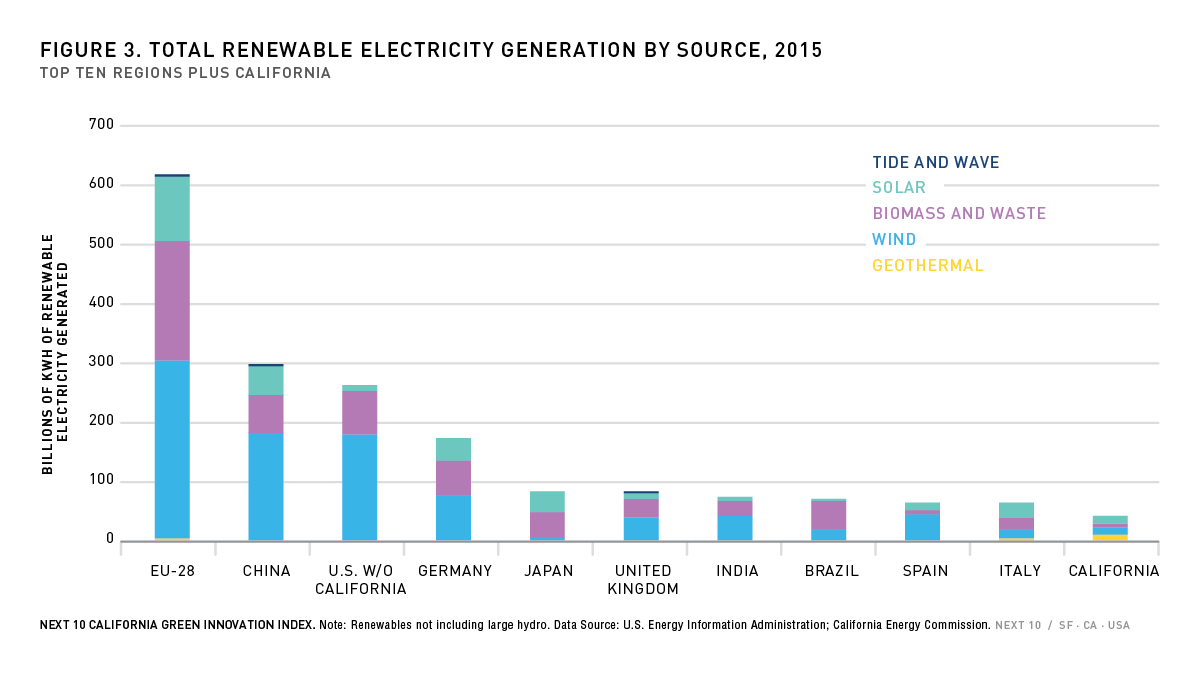
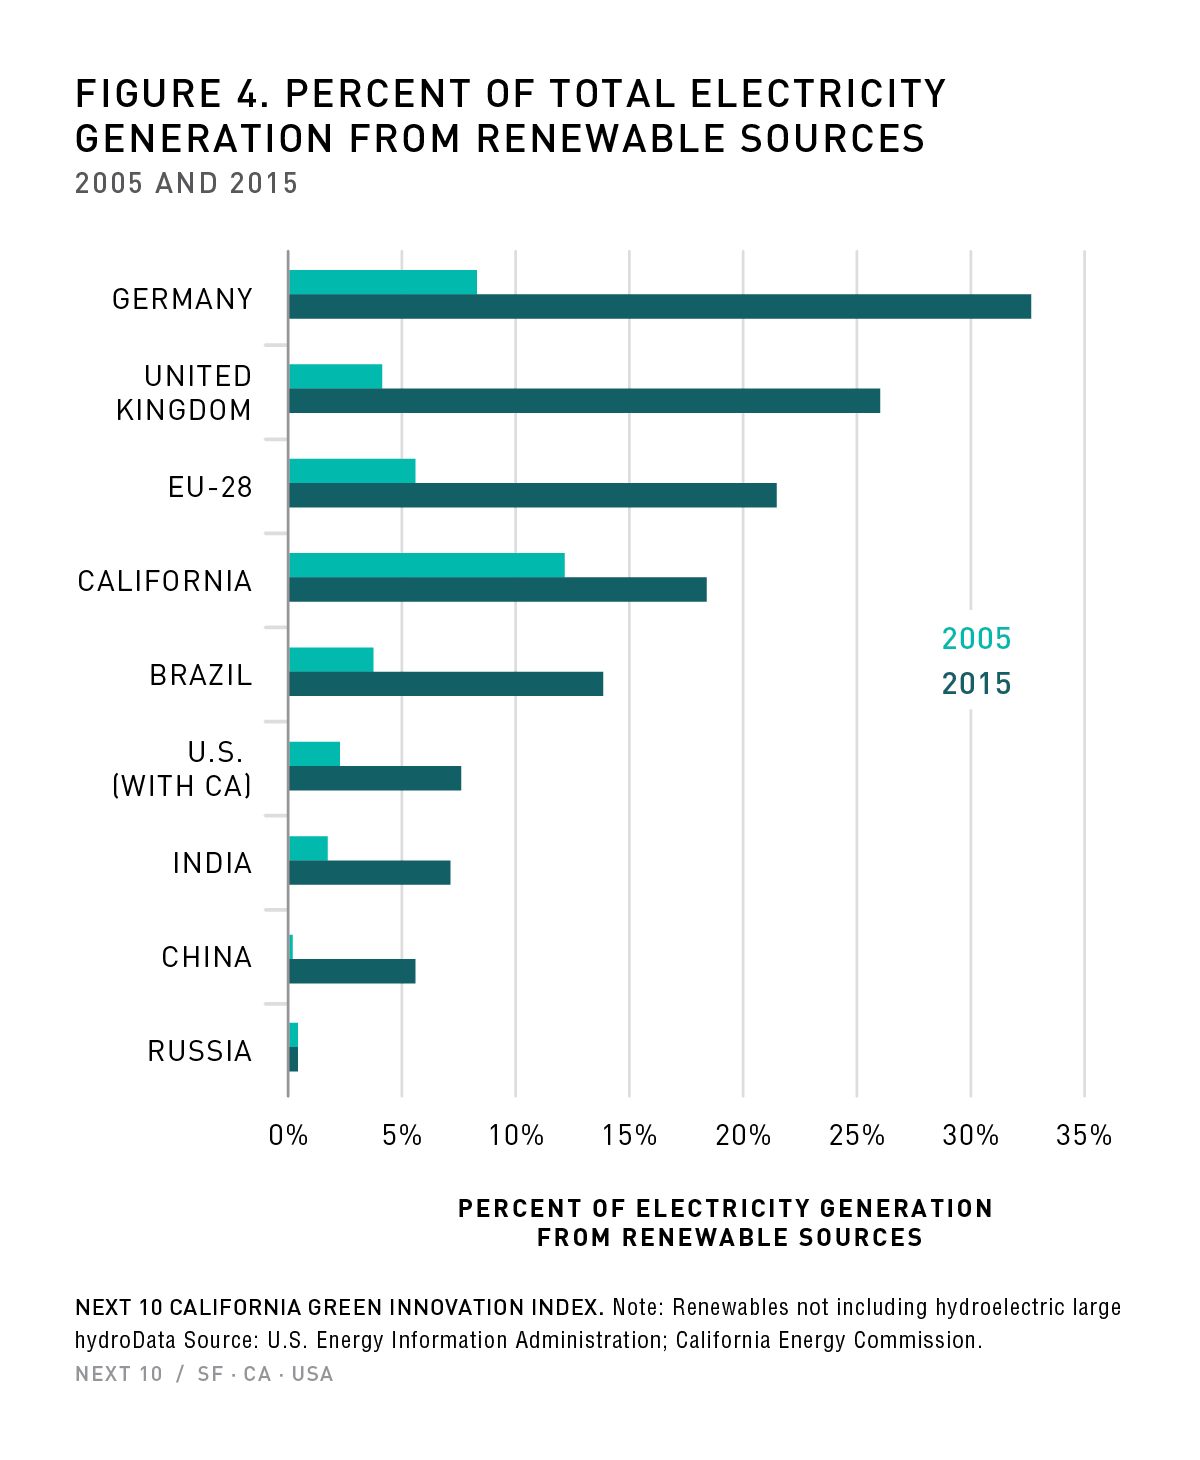
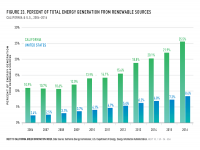
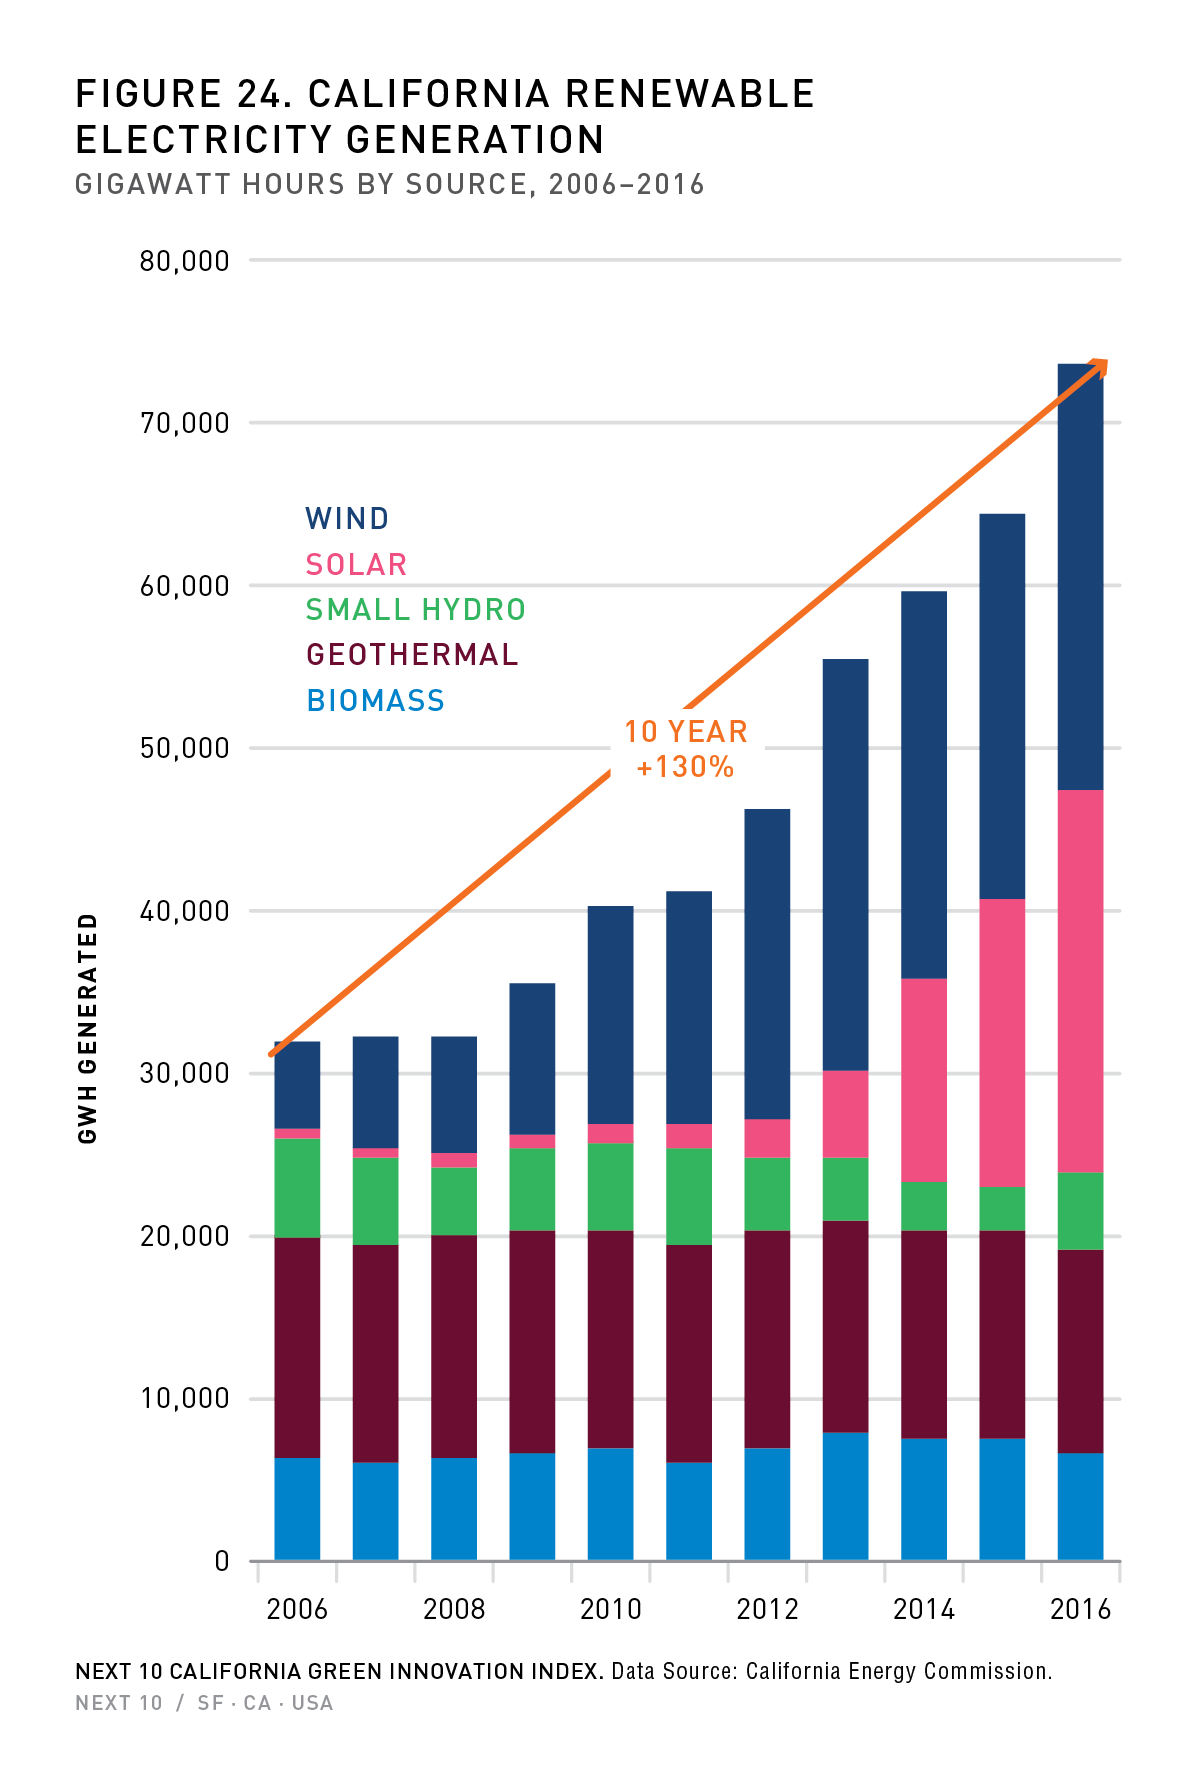
- California has increased its renewable electricity generation (from in-state and out-of-state sources) by 130 percent compared to ten years ago, and solar has been the dominant driver in the state.
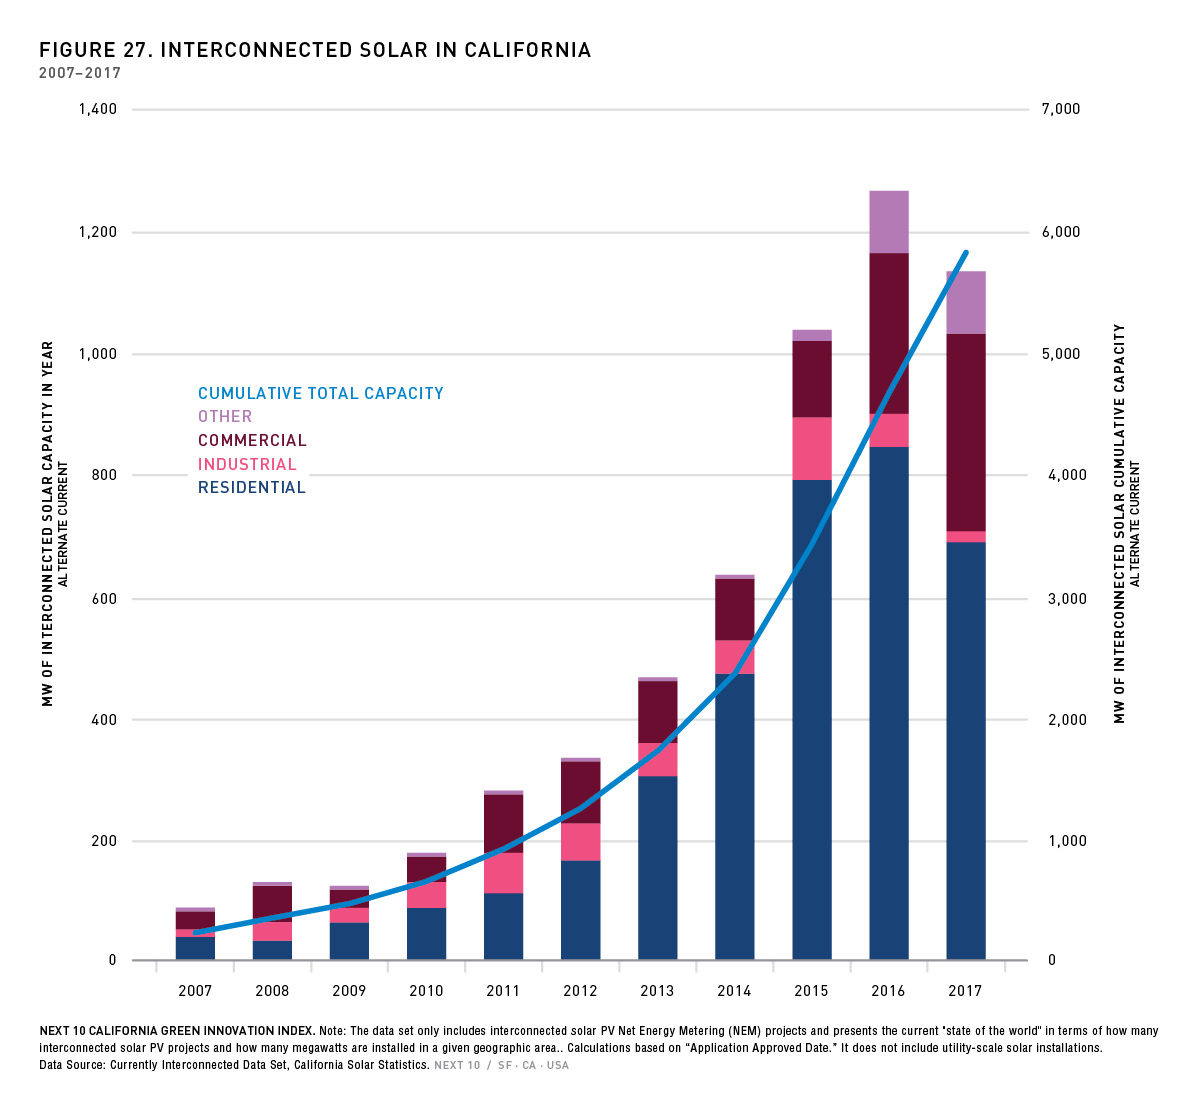
- California’s cumulative solar capacity stands at almost 6,000 GW—a nearly 2,500 percent increase compared to ten years ago when it had a mere 227.6 GW of cumulative capacity.
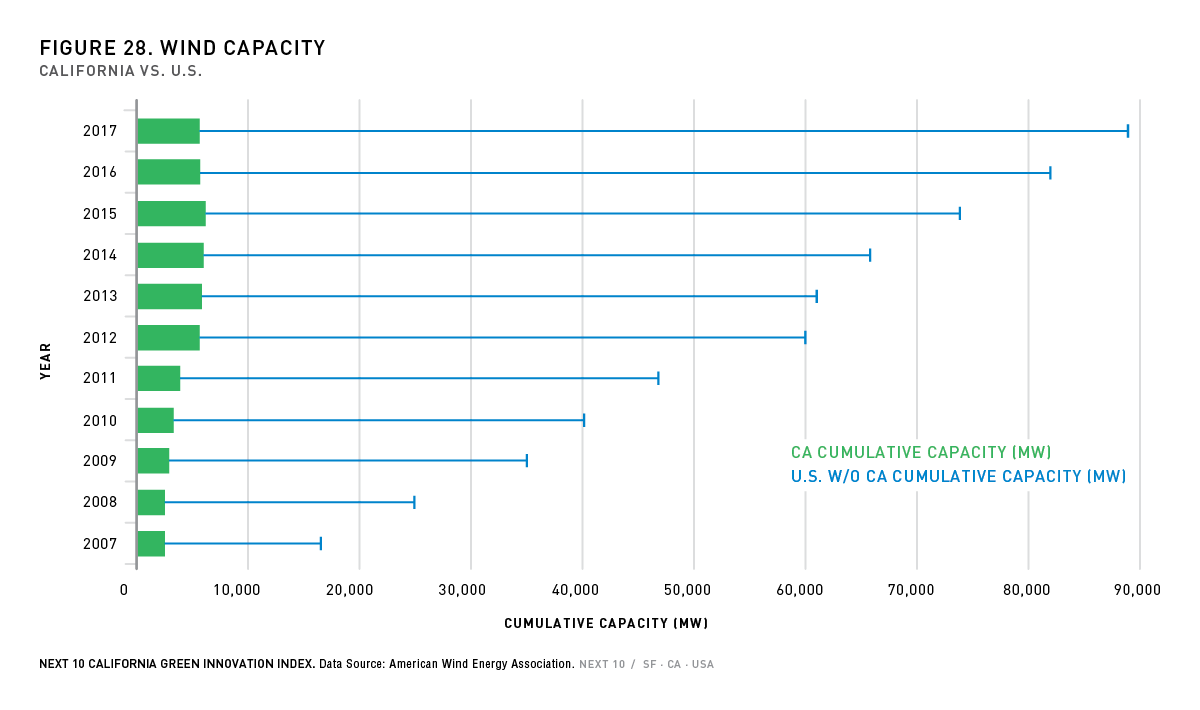
- Wind generation remains the largest renewable energy source in California when including imports. Compared to ten years ago, cumulative wind capacity installed is up by 128 percent.
- Globally, renewable energy generation increased 339 percent between 2005 and 2015, led primarily by a massive boom in solar electricity as technologies improved while costs fell.
Transportation: A Critical Challenge
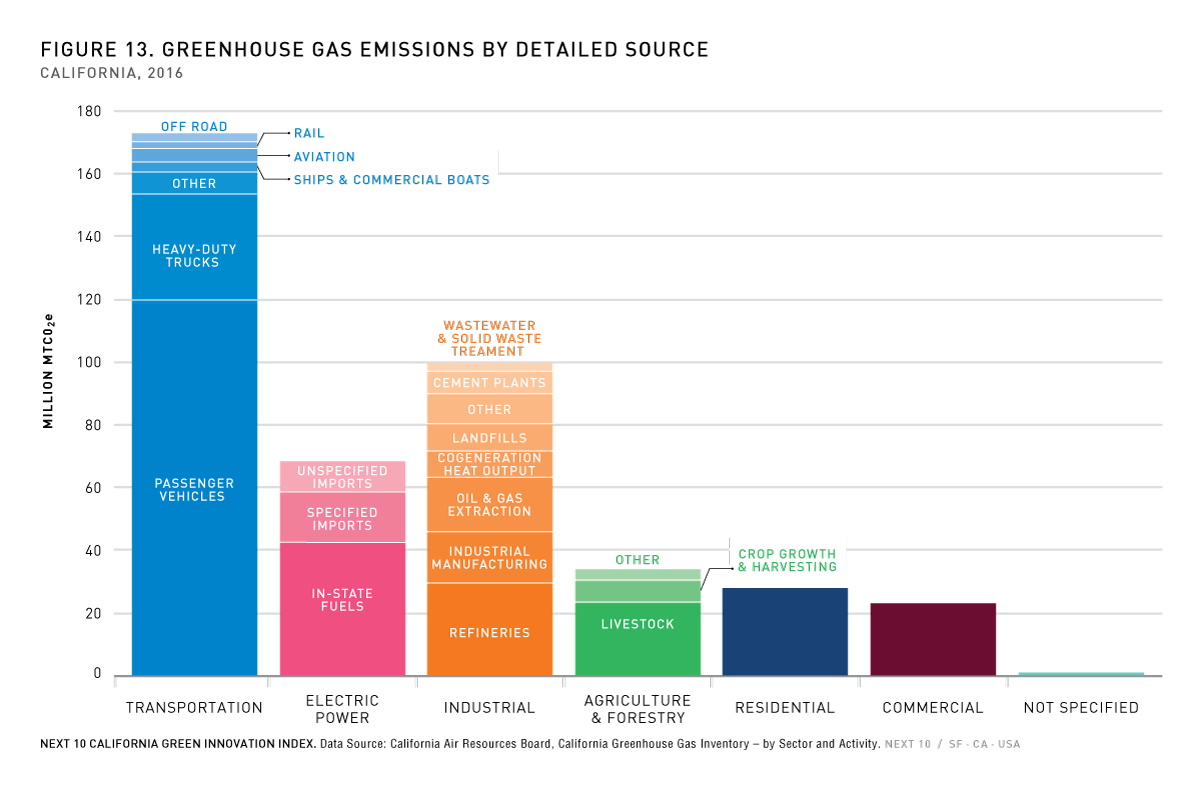
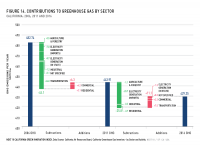
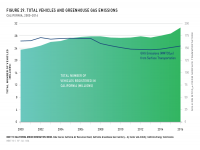
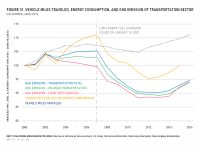
- In 2016, California’s transportation sector accounted for 40.5 percent of the state’s total greenhouse gas emissions — the highest percentage since 2006.
- On-road passenger vehicles accounted for 68.4 percent of the transportation sector’s GHG emissions.
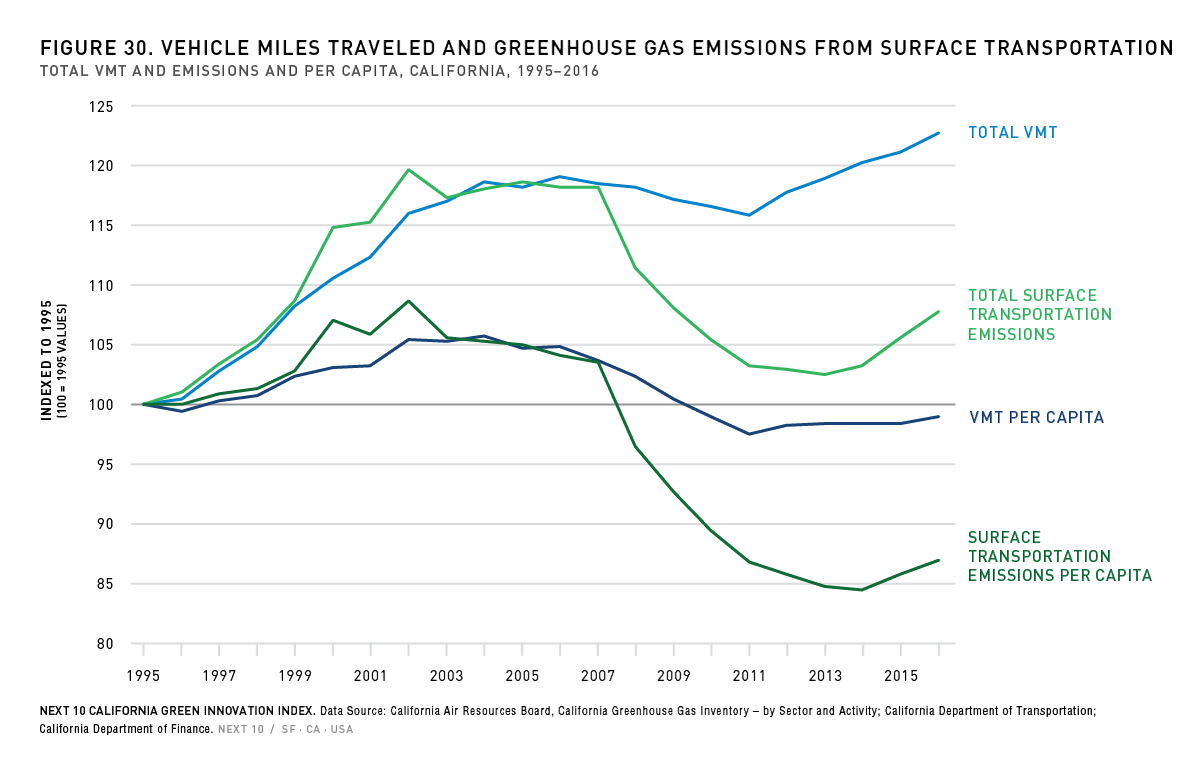
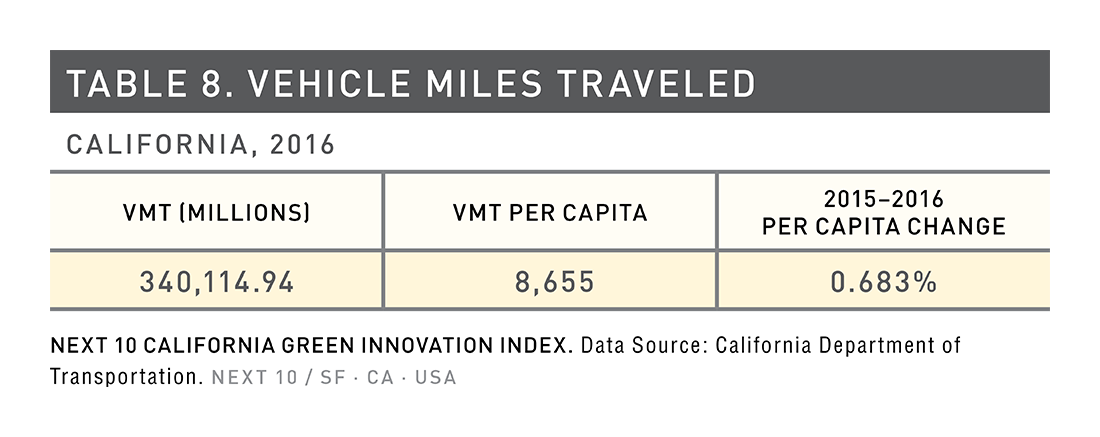
- Three million more vehicles were registered in the state between 2006 and 2016, and vehicle miles traveled (VMT) reached a record high of 340 billion in 2016, primarily due to lower oil prices and longer commutes.
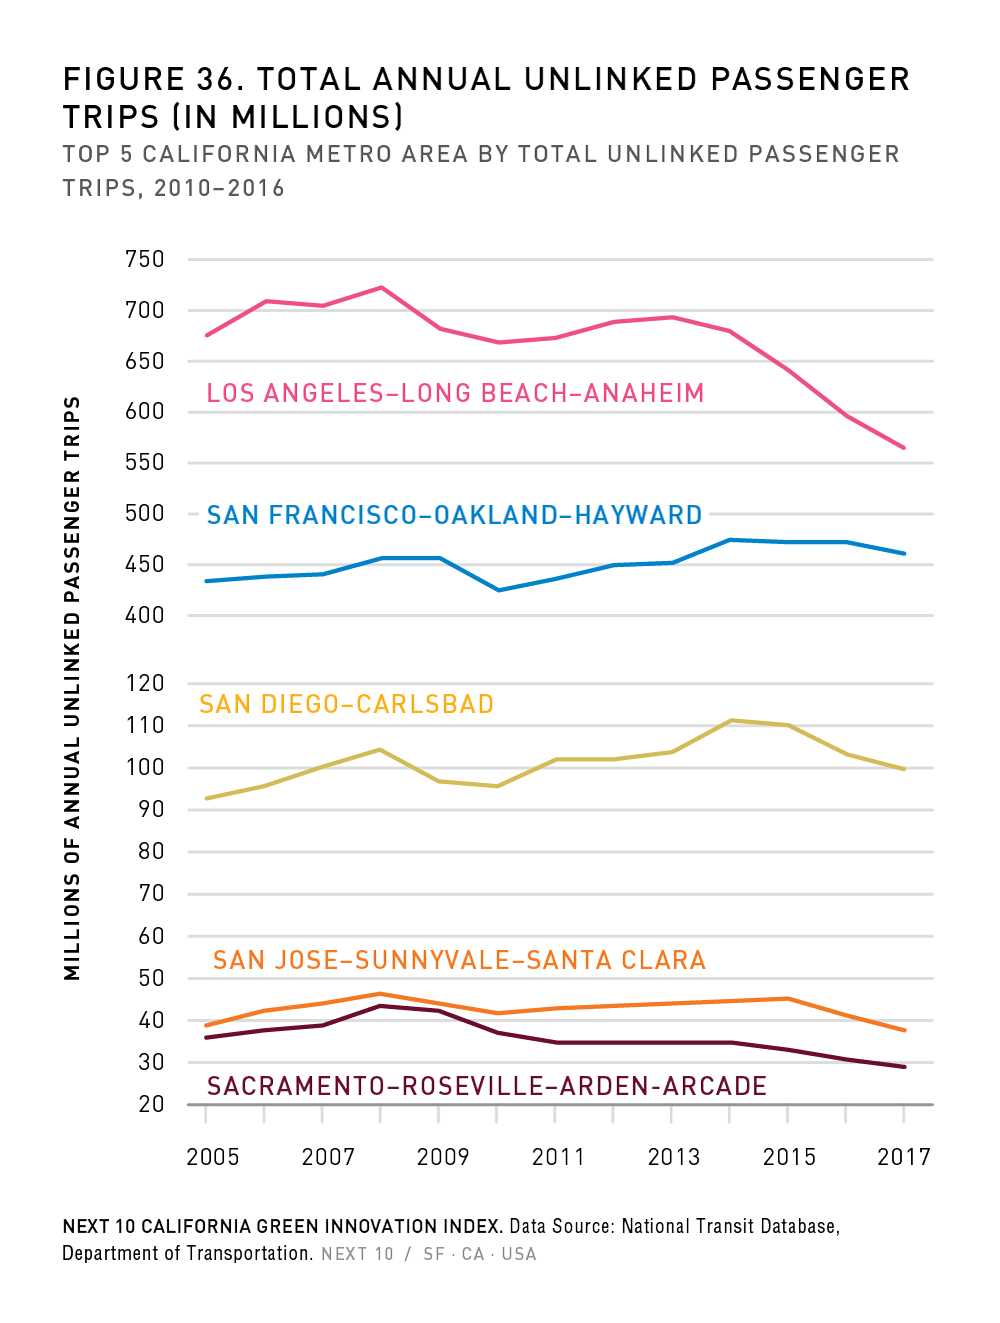
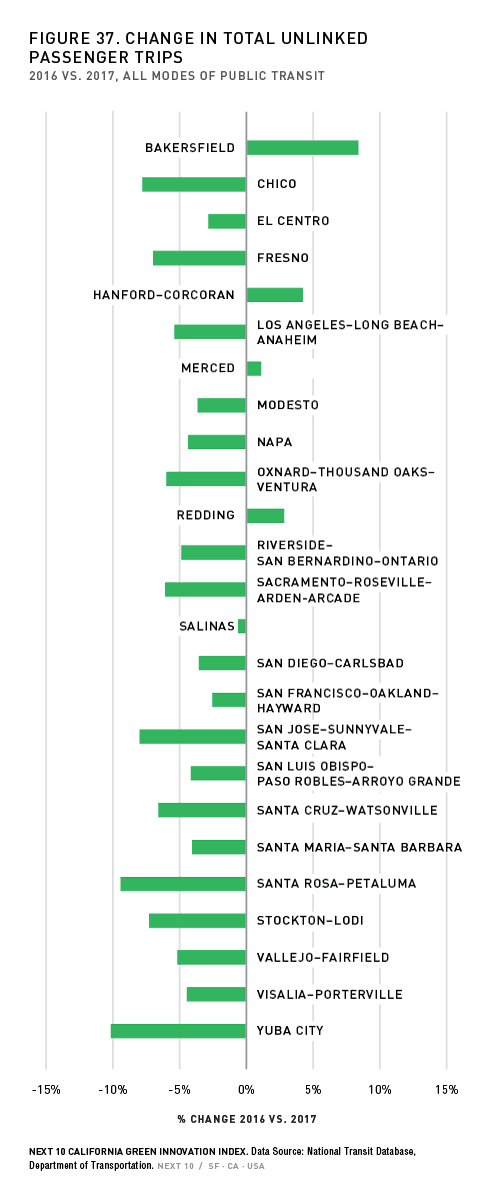
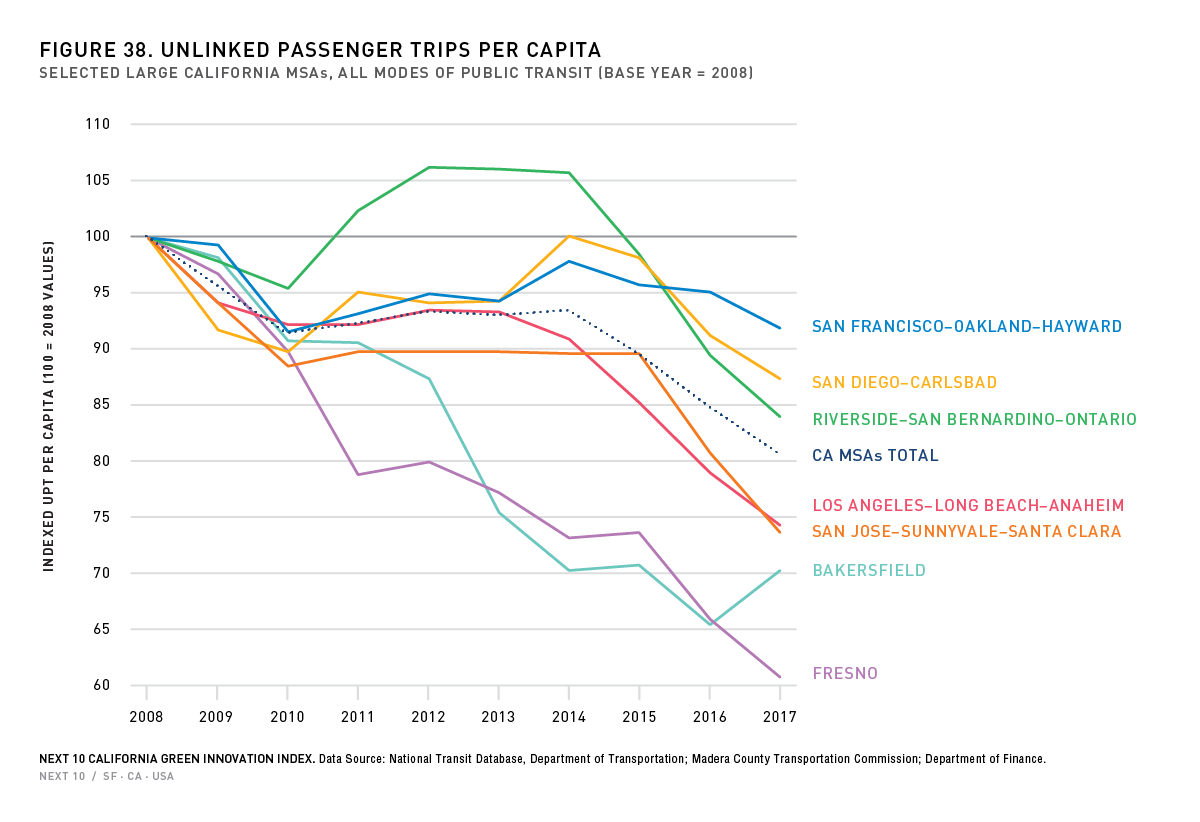
- Public transportation ridership fell for the second year in a row. Compared to 2016, total trips dropped 4.2 percent.
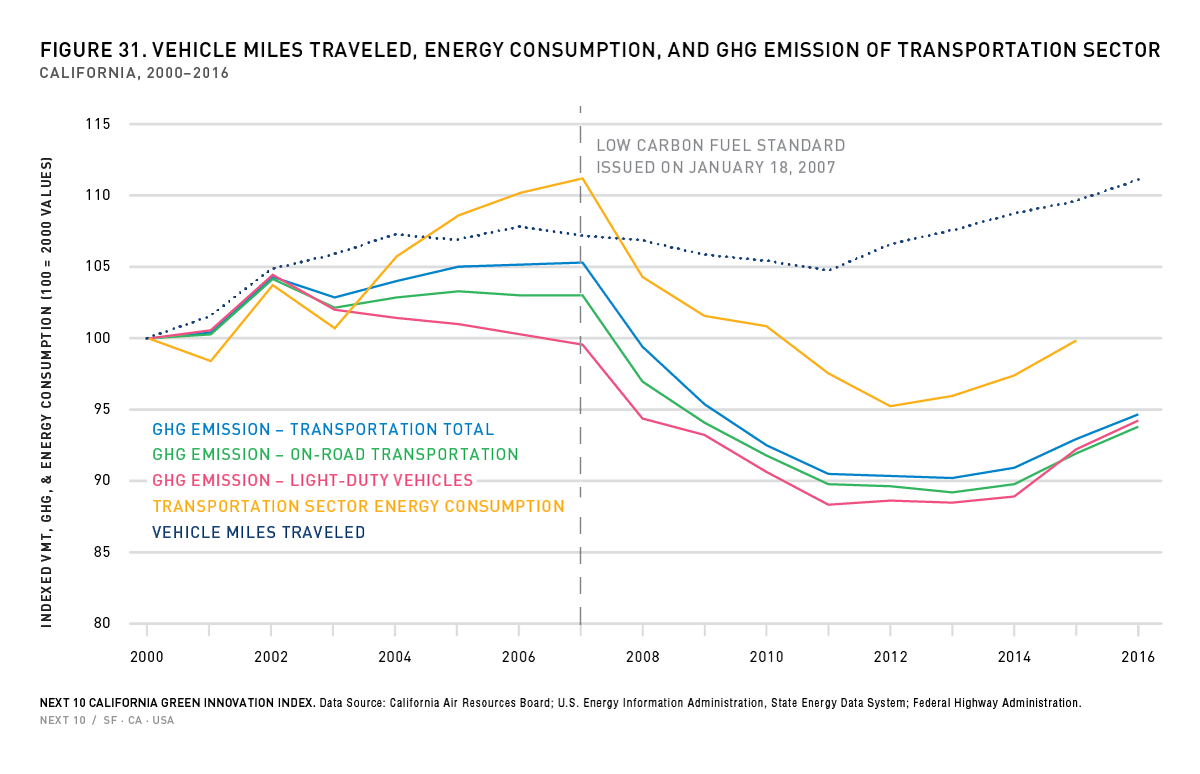
- Emissions from light-duty vehicles shot up in 2016, as did emissions from heavy-duty trucks, while overall heavy-duty emissions were 13.1 percent below 2008’s level, due in part to cleaner buses.
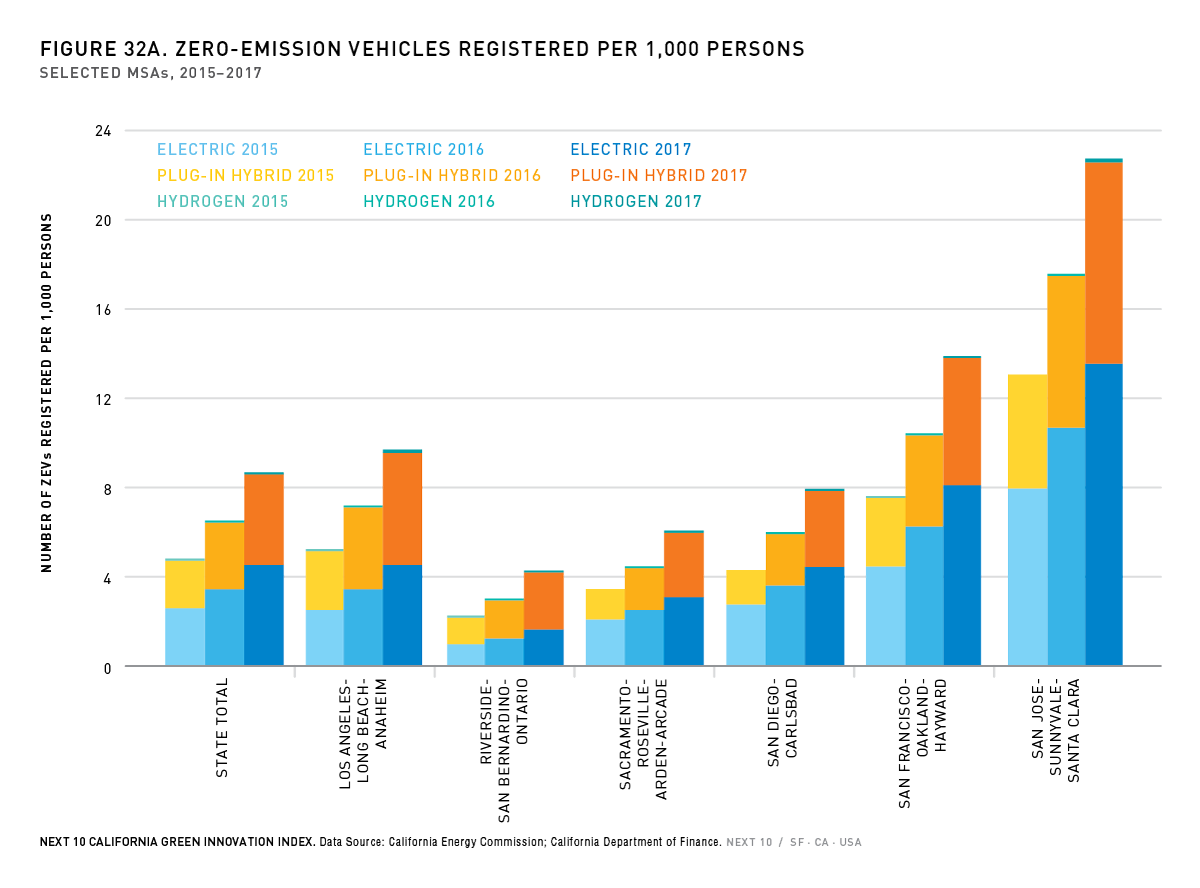
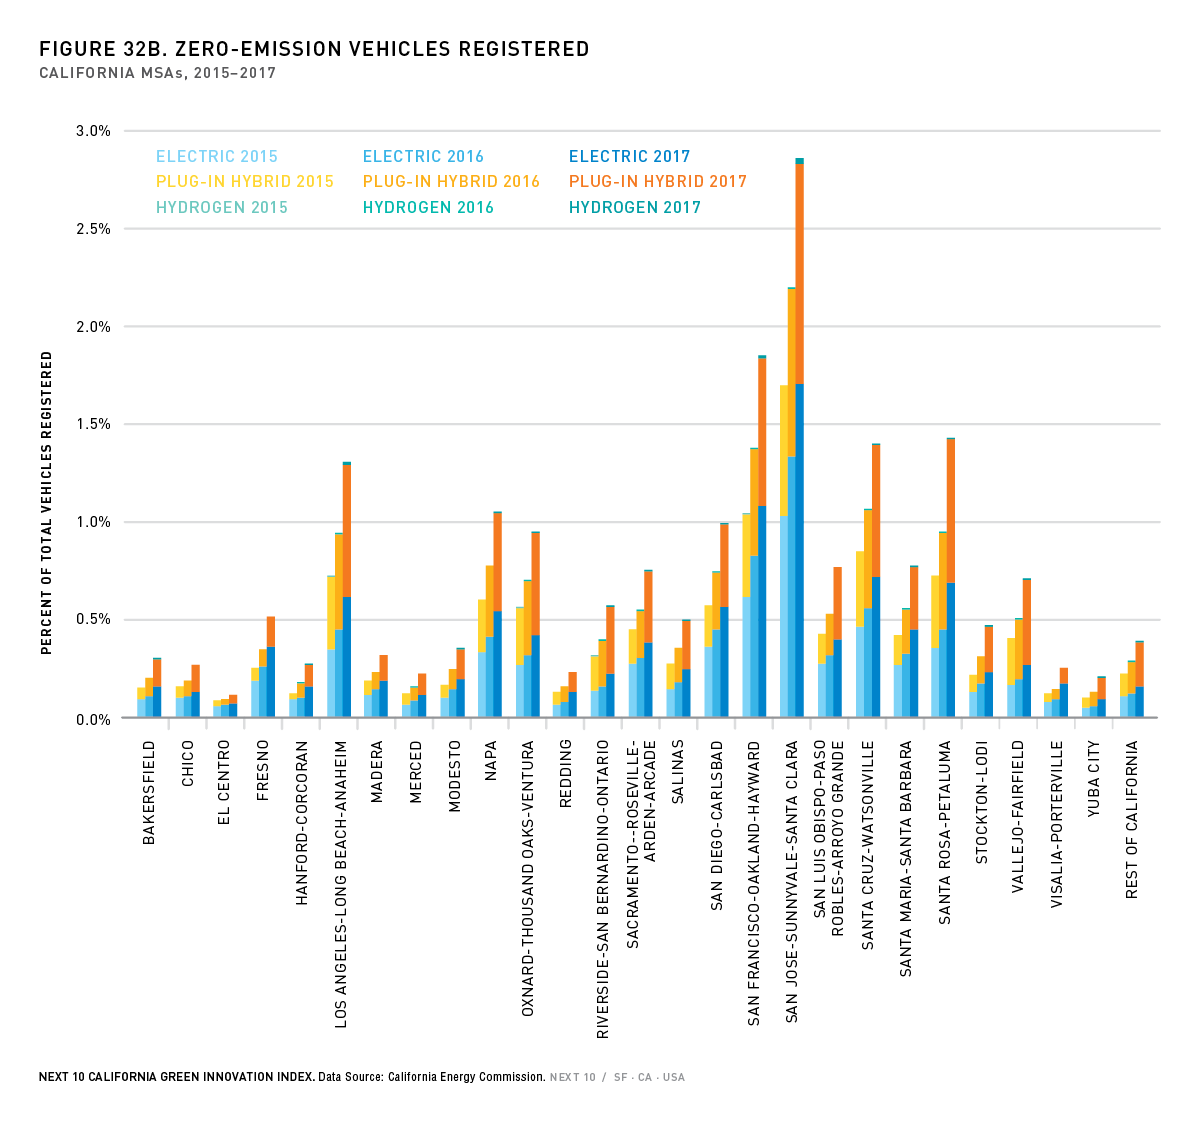
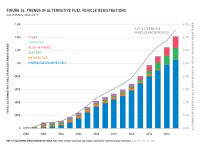
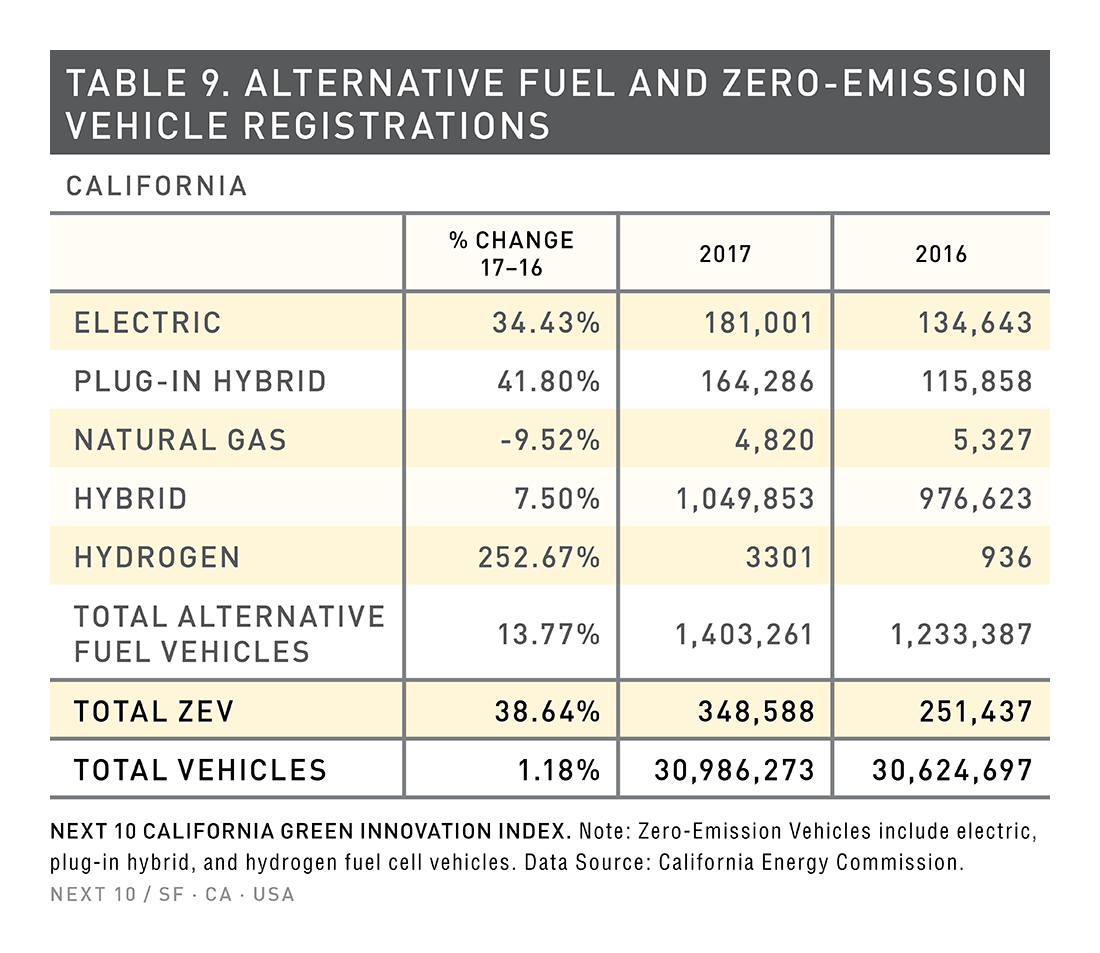
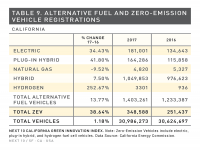
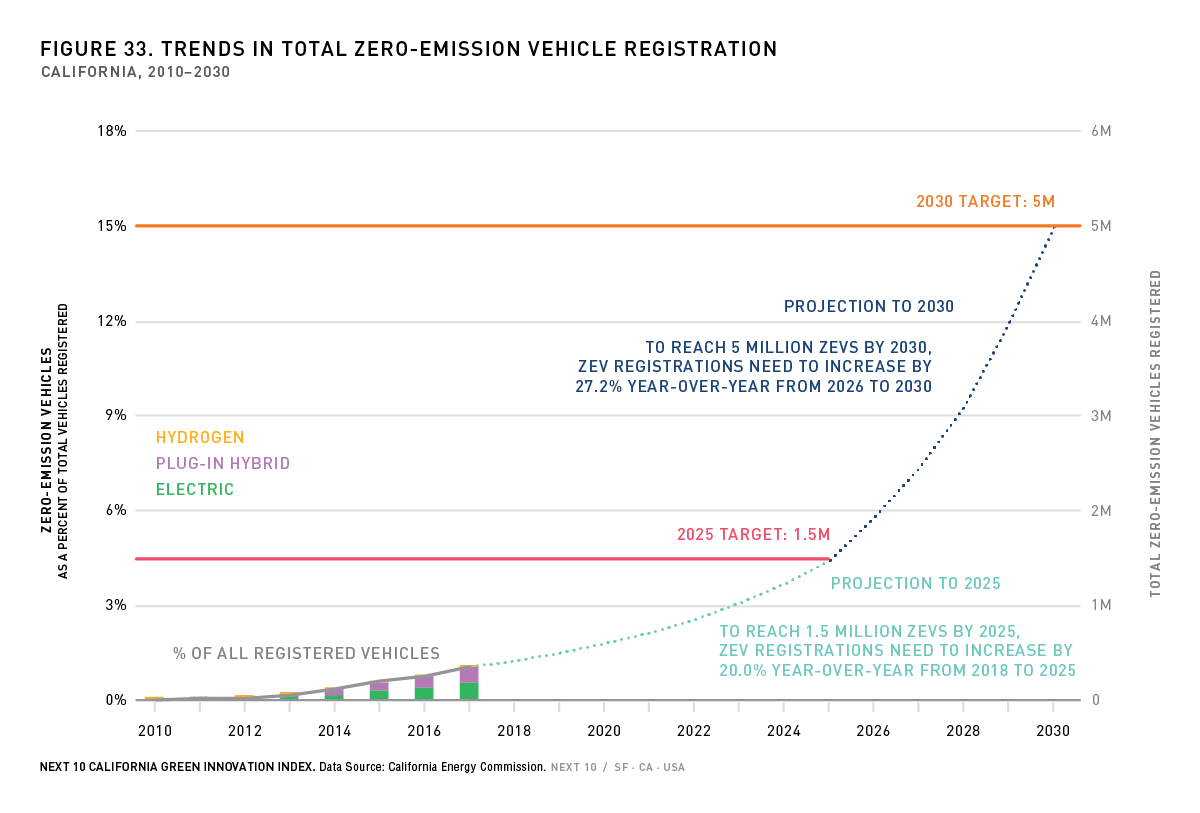
- However, for the first time in state history, conventional internal combustion engine vehicles fueled by gasoline and diesel accounted for less than 90 percent of all on-road vehicles registered in California in 2017.
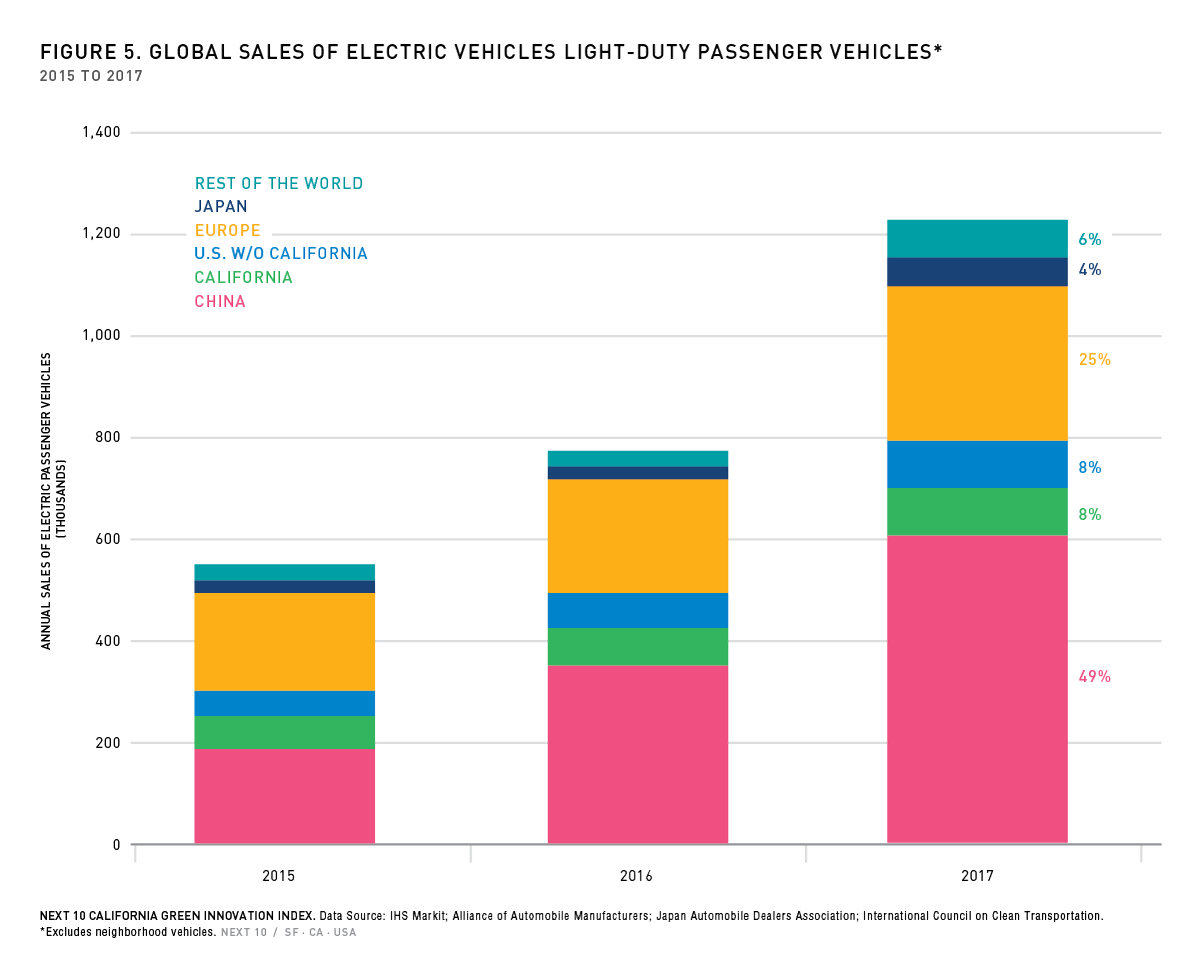
- California is home to about 47 percent of all electric vehicles ever sold in the U.S. and from 2016-17, the number of zero-emission vehicles (ZEVs) registered in California rose by 38.6 percent. China accounted for 49 percent of global EV sales in 2017.
Highlights from the Regional Scorecards
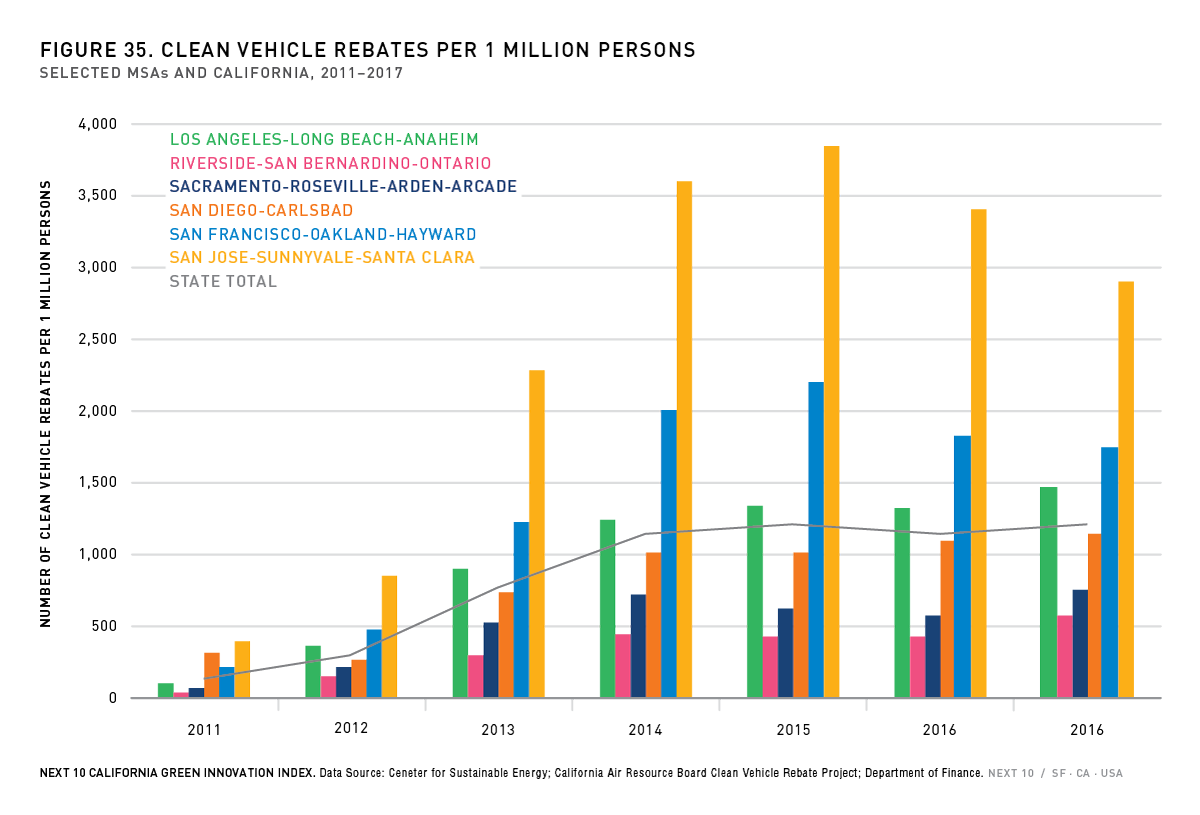
- Los Angeles-Long Beach-Anaheim maintained its top spot for clean vehicle rebates with 19,562 in 2017, an increase of 11.2 percent year over year.
- On a percentage basis, smaller, inland metros saw the largest increases in clean vehicle rebates in 2017: Visalia-Porterville (+215%), Hanford-Corcoran (+85%), and Chico (+66%).
- Drivers in Santa Maria-Santa Barbara had the lowest average commute time in 2016, spending just 18.3 minutes behind the wheel. Workers from Redding (19.6 minutes) and Hanford-Corcoran (20.6 minutes) also enjoyed relatively short commutes.
- Unlinked passenger trips (UPTs) on public transportation continued to decline in California, and Hanford-Corcoran is the only MSA where public transportation trips per capita have increased for four consecutive years.
- Sunny Southern California metro areas had the most solar photovoltaic capacity installed in 2017, with Riverside-San Bernardino-Ontario adding the most solar PV capacity in 2017 with 173.4 megawatt (MW) of capacity installed across all sectors combined.
- On a per capita basis, however, the Central Valley had the most per capita solar PV capacity installed. In 2017, Madera had the most capacity installed per person (0.14 MW/person), followed by Visalia-Porterville (0.13 MW/person) and Hanford-Corcoran (0.11 MW/person).
Next 10 owns the copyright to all graphics in this section, and they are available for download and limited use, subject to our Terms of Use. Please contact Next 10 at info@next10.org with any questions.