Publications
Beyond the Gas Tax: Funding California Transportation in the 21st Century
New report examines transportation infrastructure funding in California and how it compares to other states, highlighting potential options to help the state further address the current transportation funding gap.
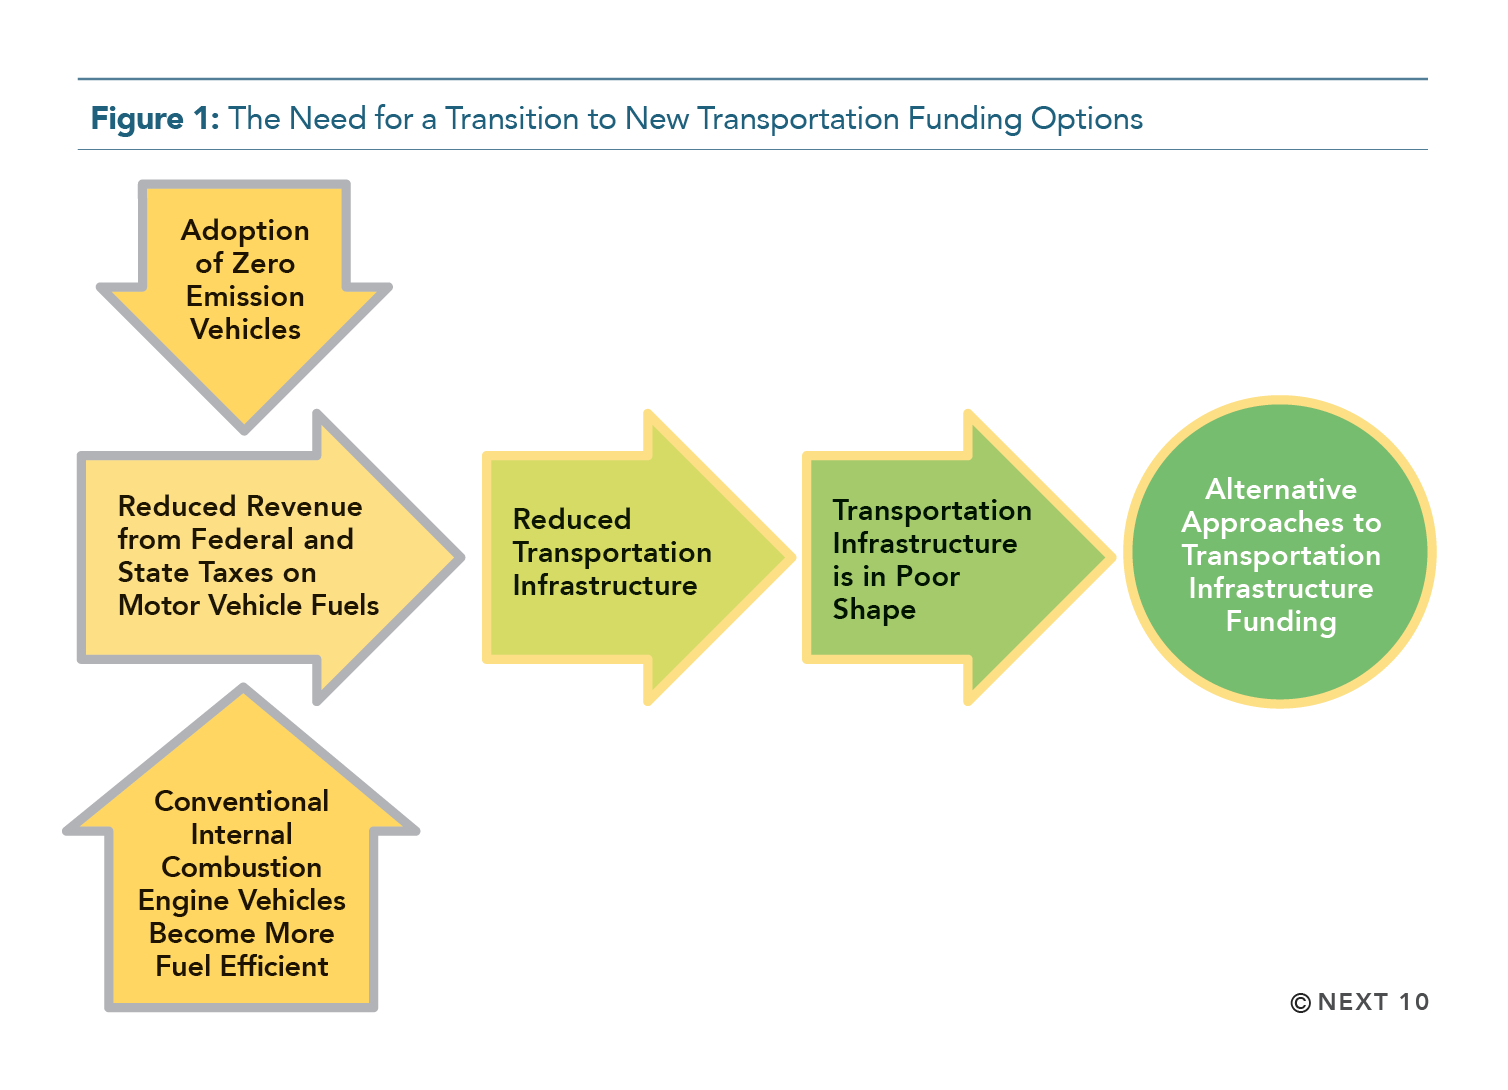
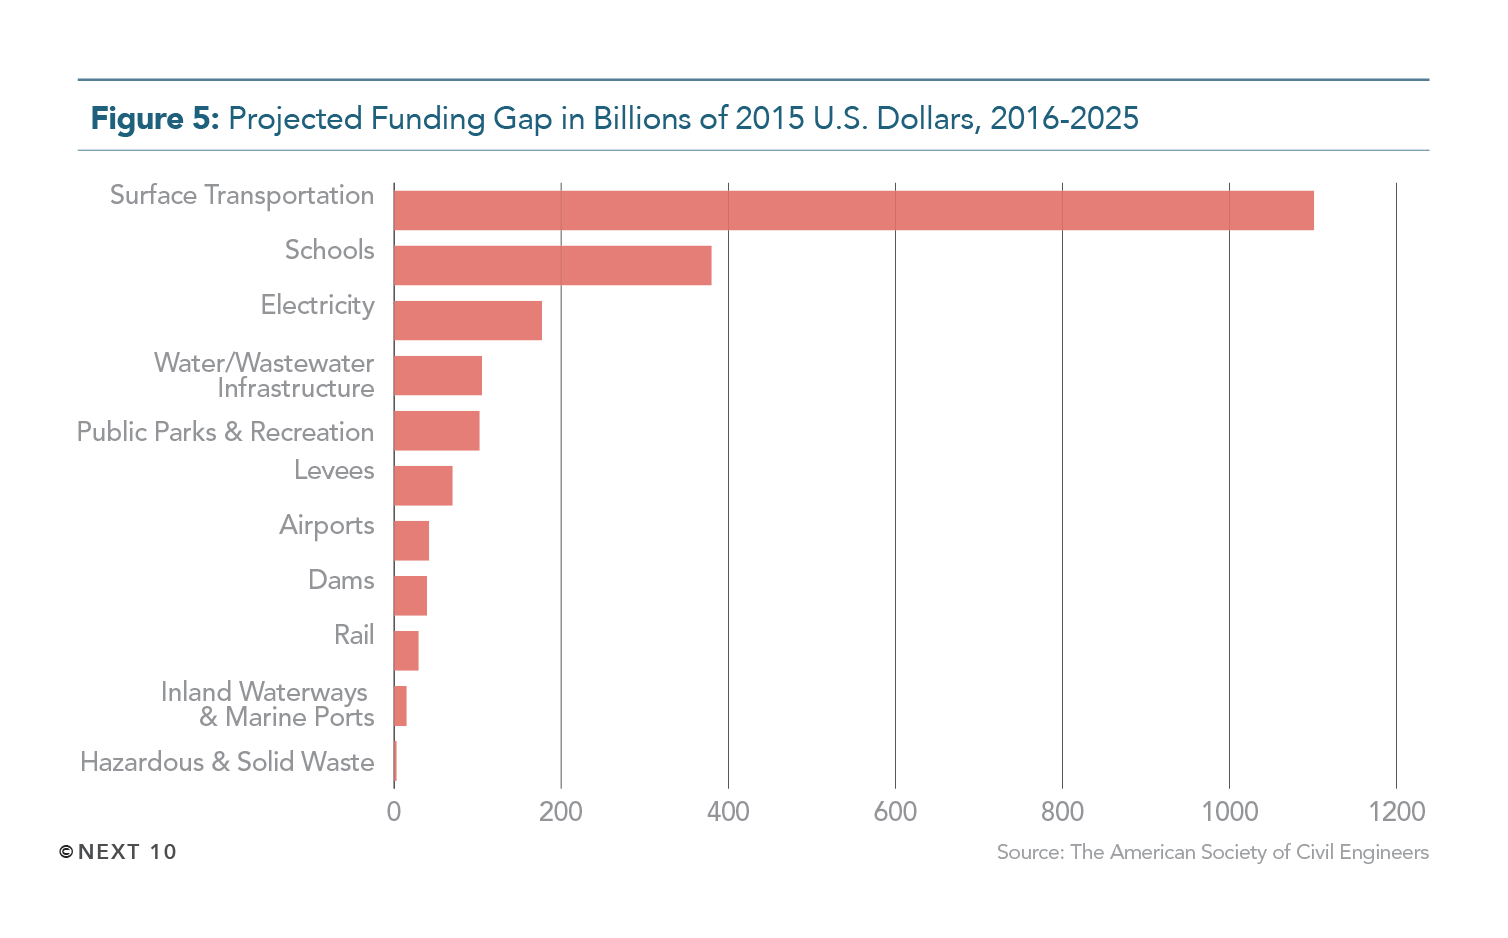
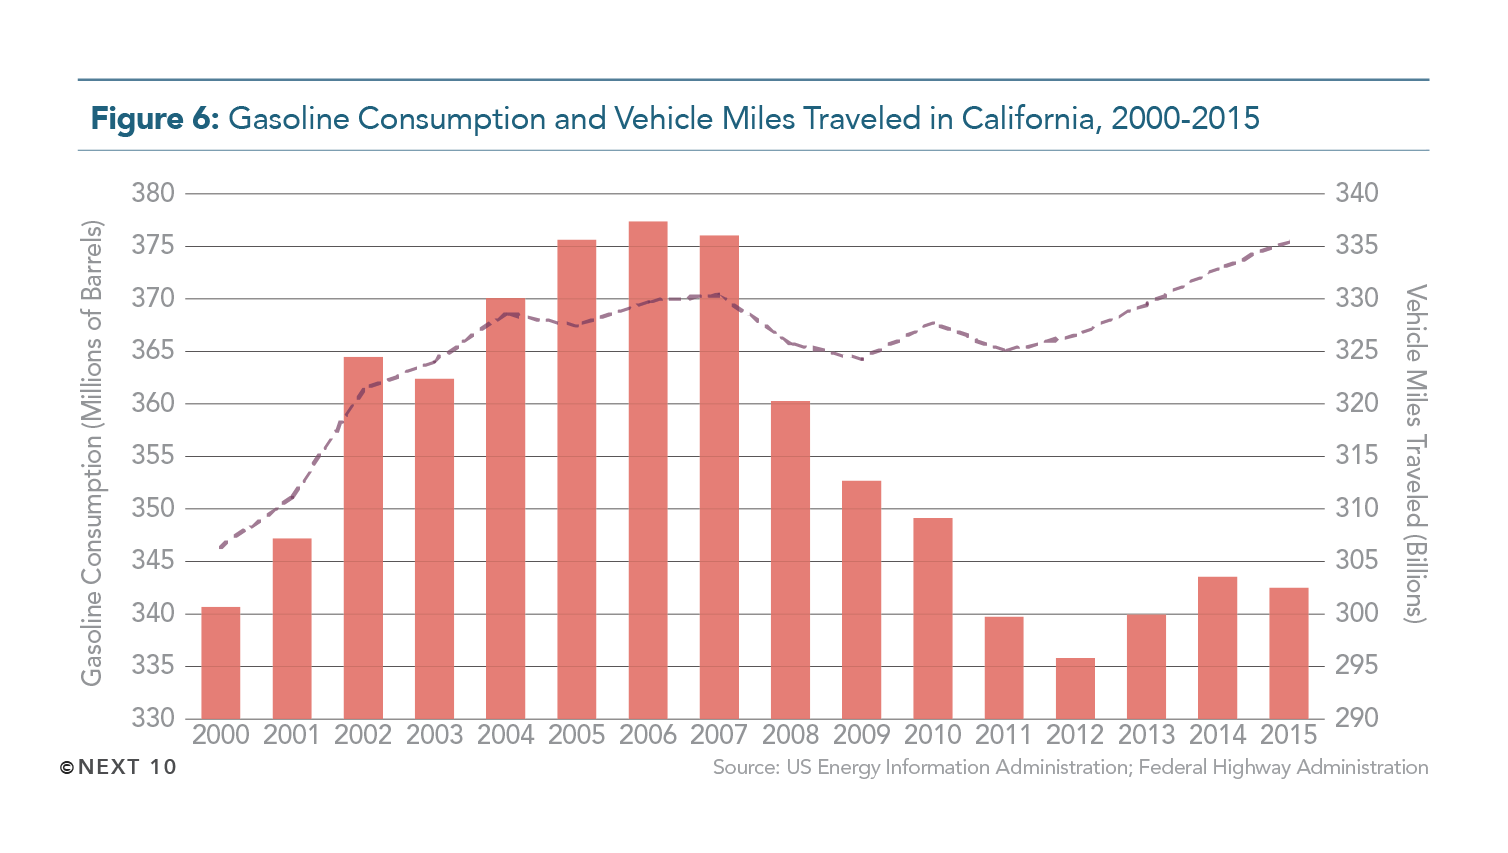
While California roads are among the worst in the nation, funding for repairs and improvements—which traditionally comes largely from motor vehicle fuel taxes—is declining as cars become more fuel-efficient and the state's electric vehicle fleet grows. Senate Bill 1 (SB 1) is expected to bring in $52.4 billion in revenue over a ten-year period, but that figure falls short of the current $137 billion deferred maintenance deficit that has not been addressed. The deficit may also continue to grow—inflation-adjusted fuel tax revenue declined 20 percent from 2010 to 2015, despite the fact that Californians have been driving more than ever, logging a record 335 billion vehicle travelled in 2015. California must develop a sustainable new model for transportation funding in order to address infrastructure needs.
Beyond the Gas Tax: Funding California Transportation in the 21st Century is the latest comparative analysis brief powered by data from Next 10’s Compare50.org.
Next 10 owns the rights to this publication. Any usage of content from this publication is subject to our Terms of Use.
Roadways Infrastructure
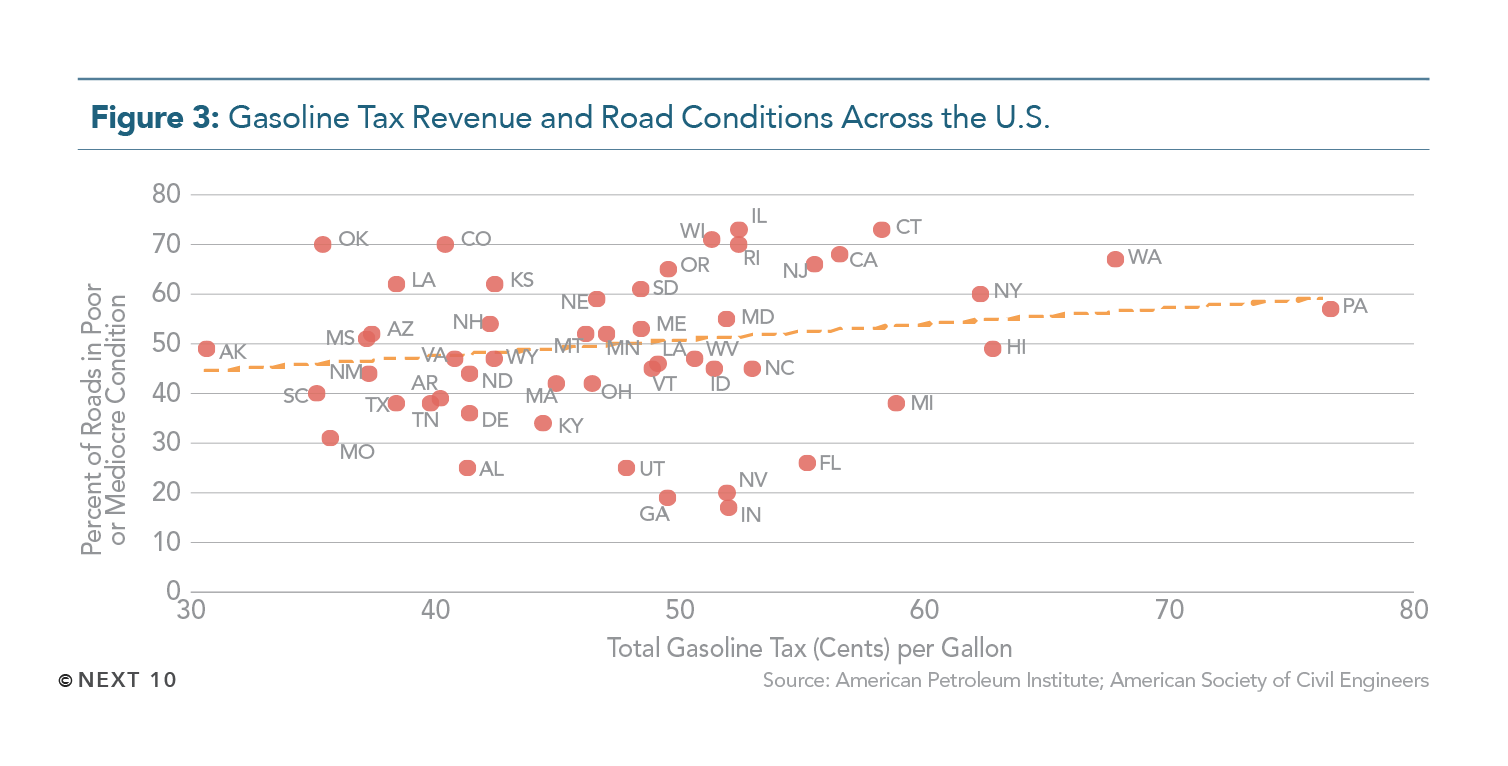
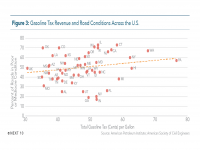
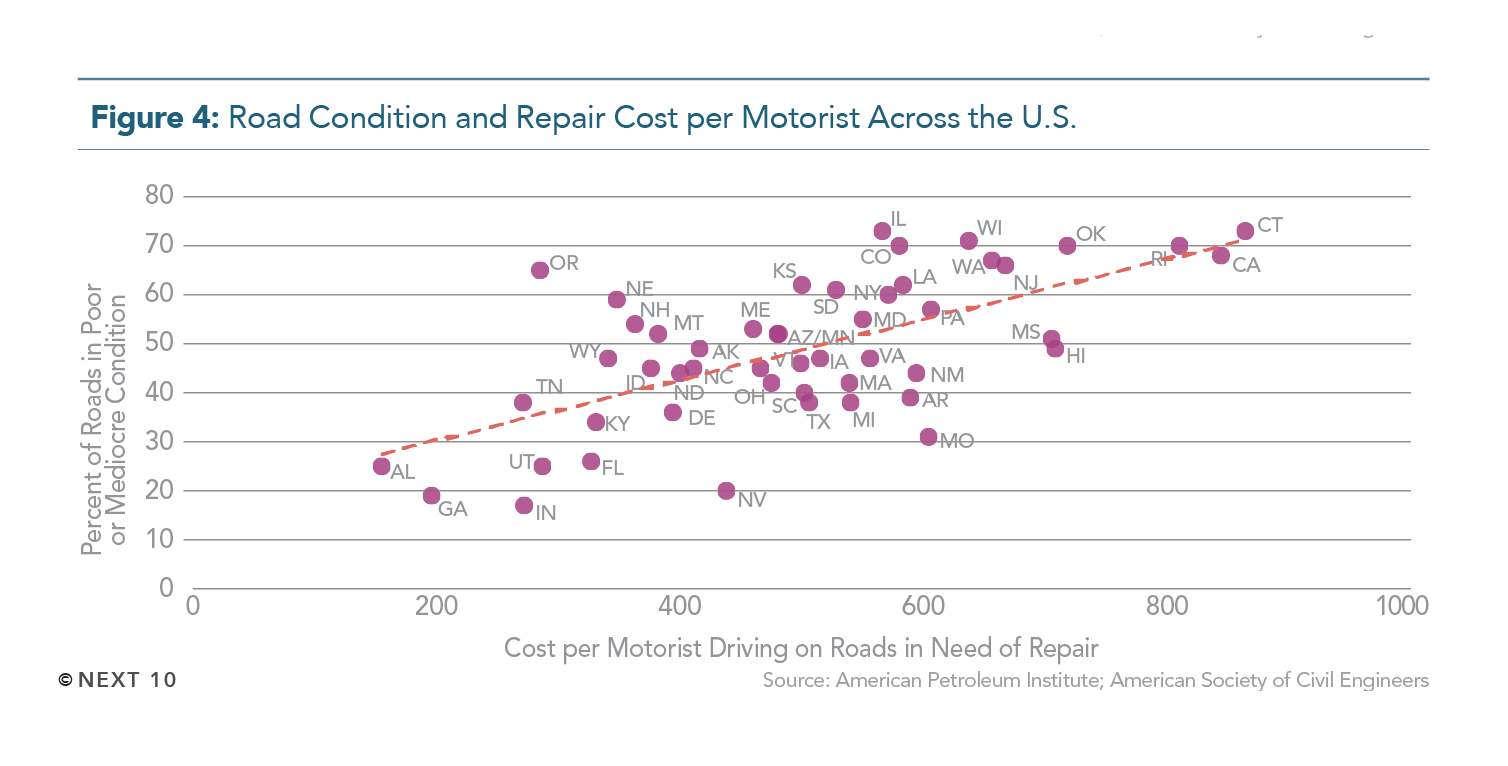
- 68 percent of the Golden State’s roadways are in either poor or mediocre condition, compared to the 24.4 percent national average.
- Most California roads are at least 40 years old, meaning they’ve reached or exceeded their designed useful life.
- Driving on poorly maintained roads costs each motorist $844 in vehicle repair costs per year in California—the highest behind Connecticut’s $864 per motorist per year.
Motor Vehicle Fuel Taxes
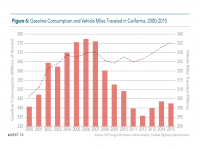
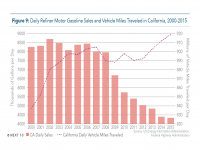
- Californians have been driving more than ever. Collectively, Californian motorists logged 335 billion vehicle-miles traveled in 2015—a record high.
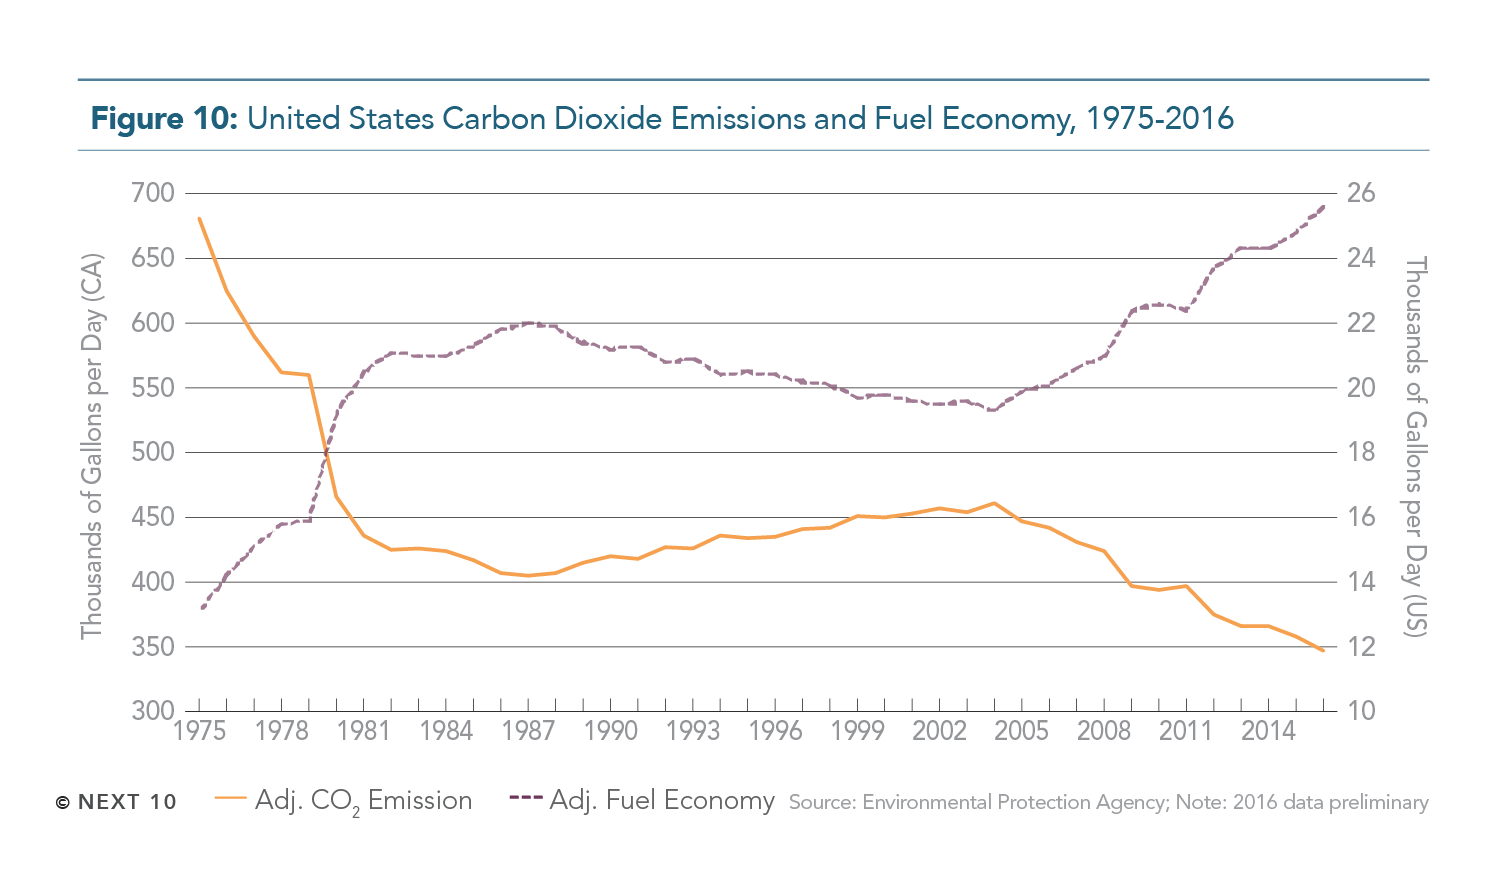
- Light-duty vehicles are becoming increasingly fuel-efficient.
- Compared to 10 years ago, new vehicles have an average improved fuel economy of 5.5 miles per gallon nationally, or 27.4 percent compared to vehicles of model year 2006.
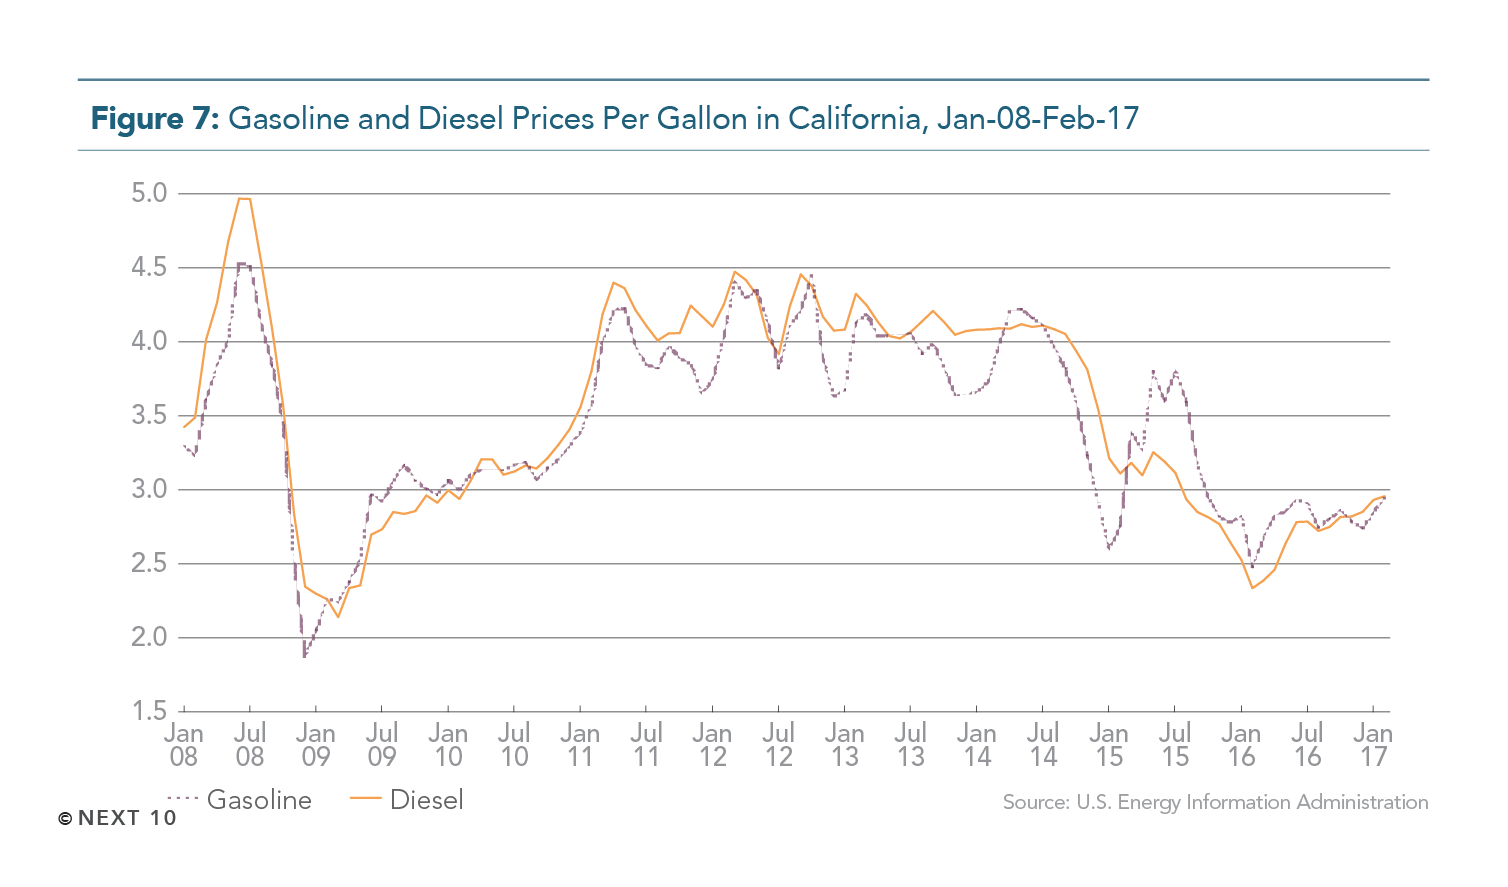
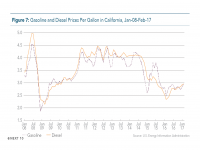
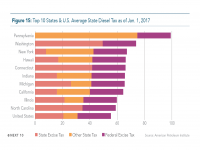
- California has some of the highest state gasoline and state diesel fuel sales taxes. As of January 1, 2017, California’s taxes on motor vehicle fuels, excluding the 18.4-cents-per-gallon federal excise tax, are:
- 38.13-cents-per-gallon for gasoline (7th highest), and
- 40.01-cents-per-gallon for diesel (8th highest)
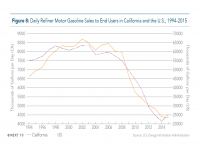
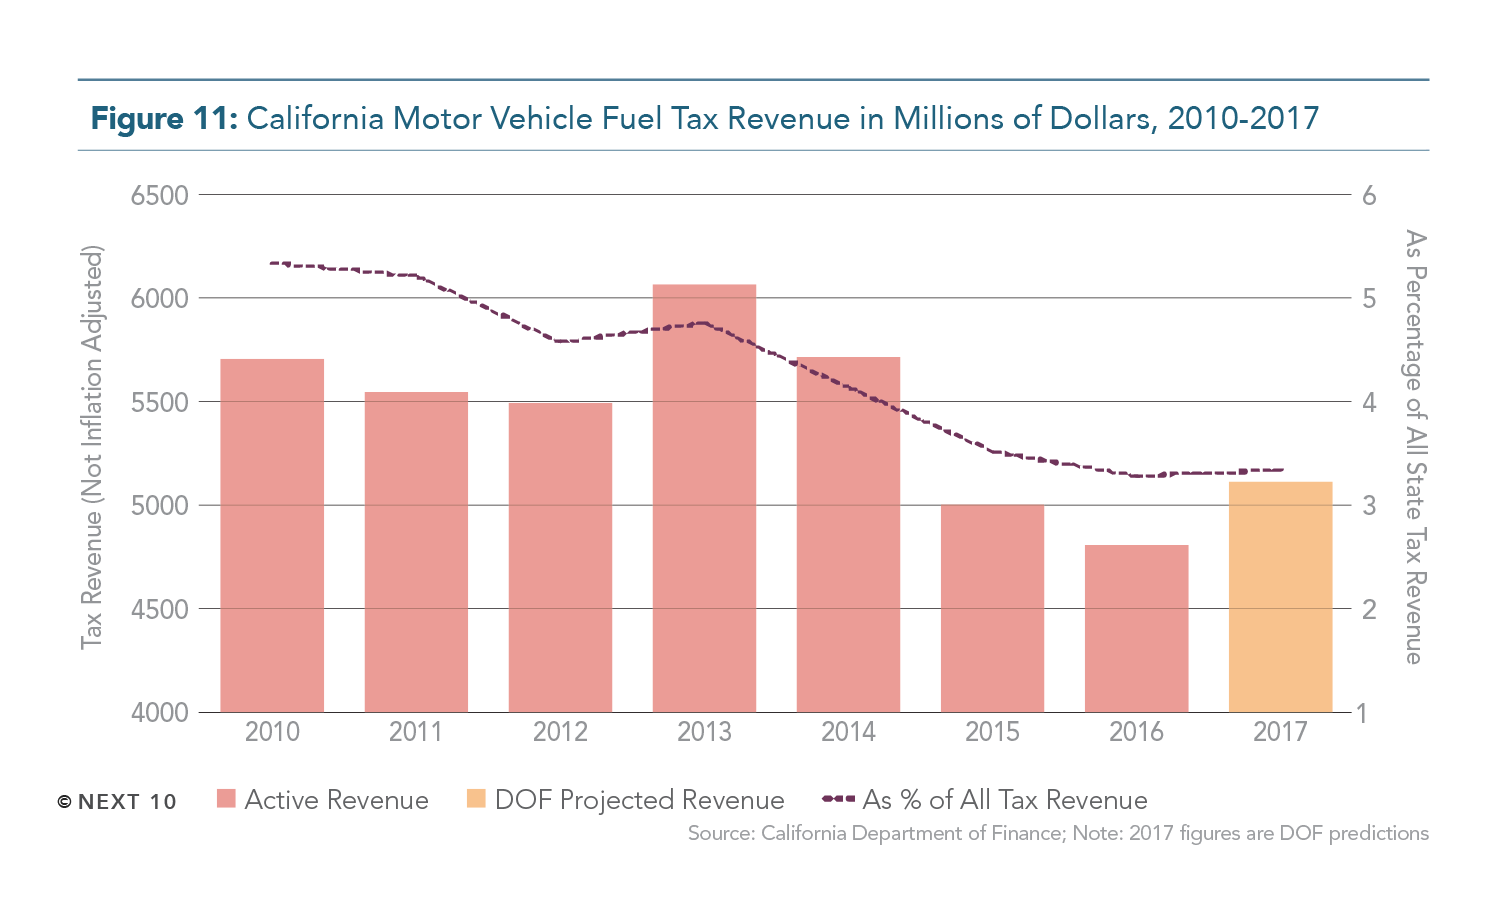
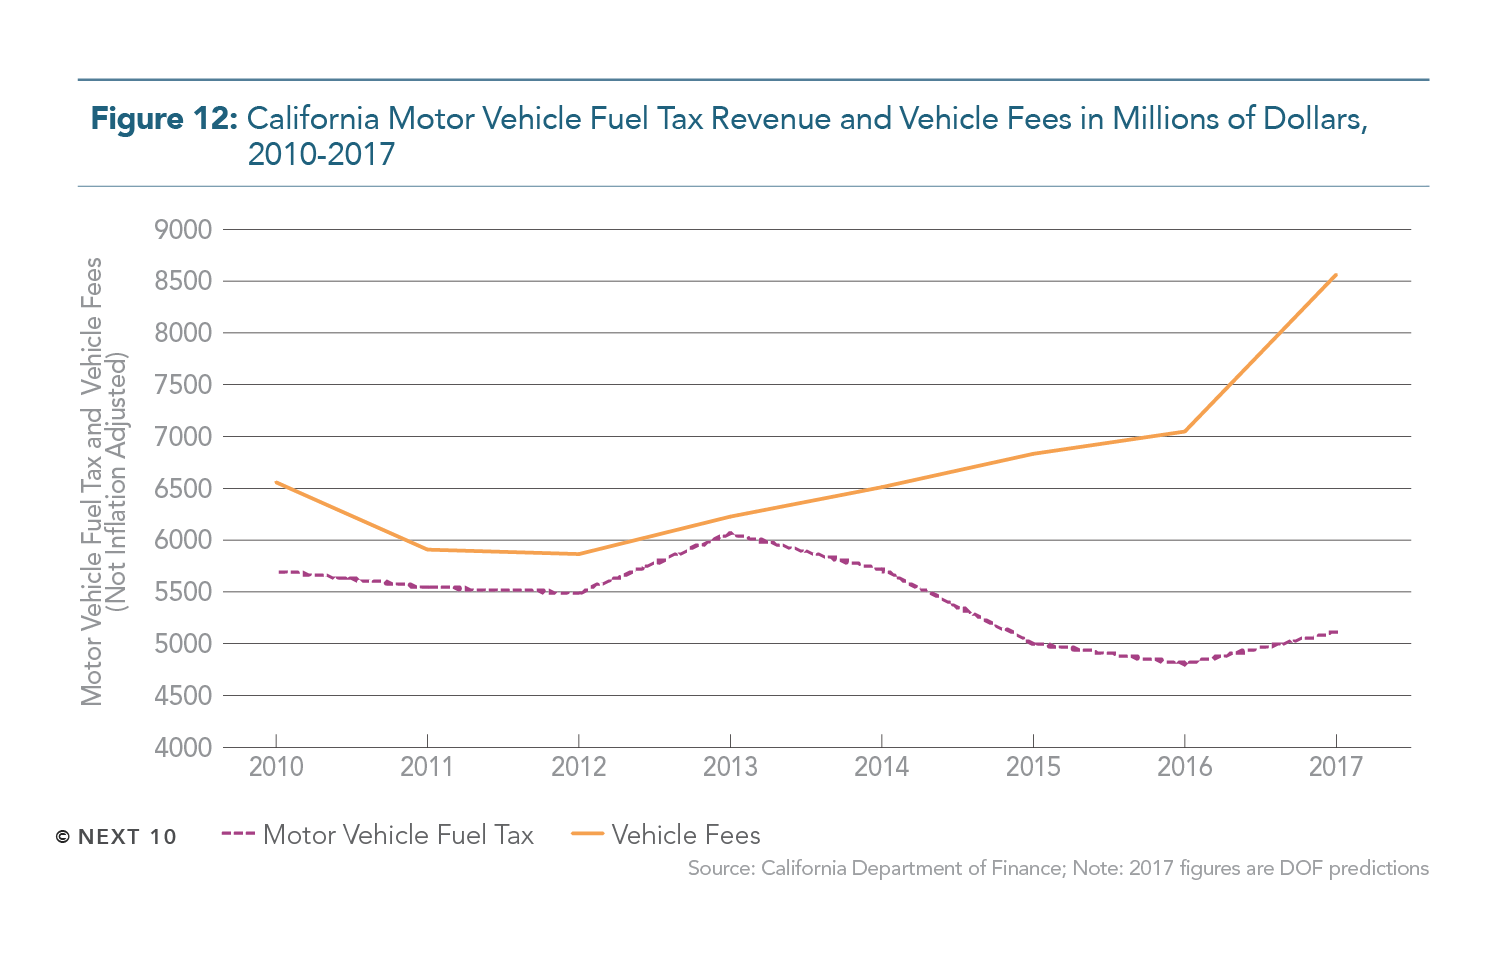
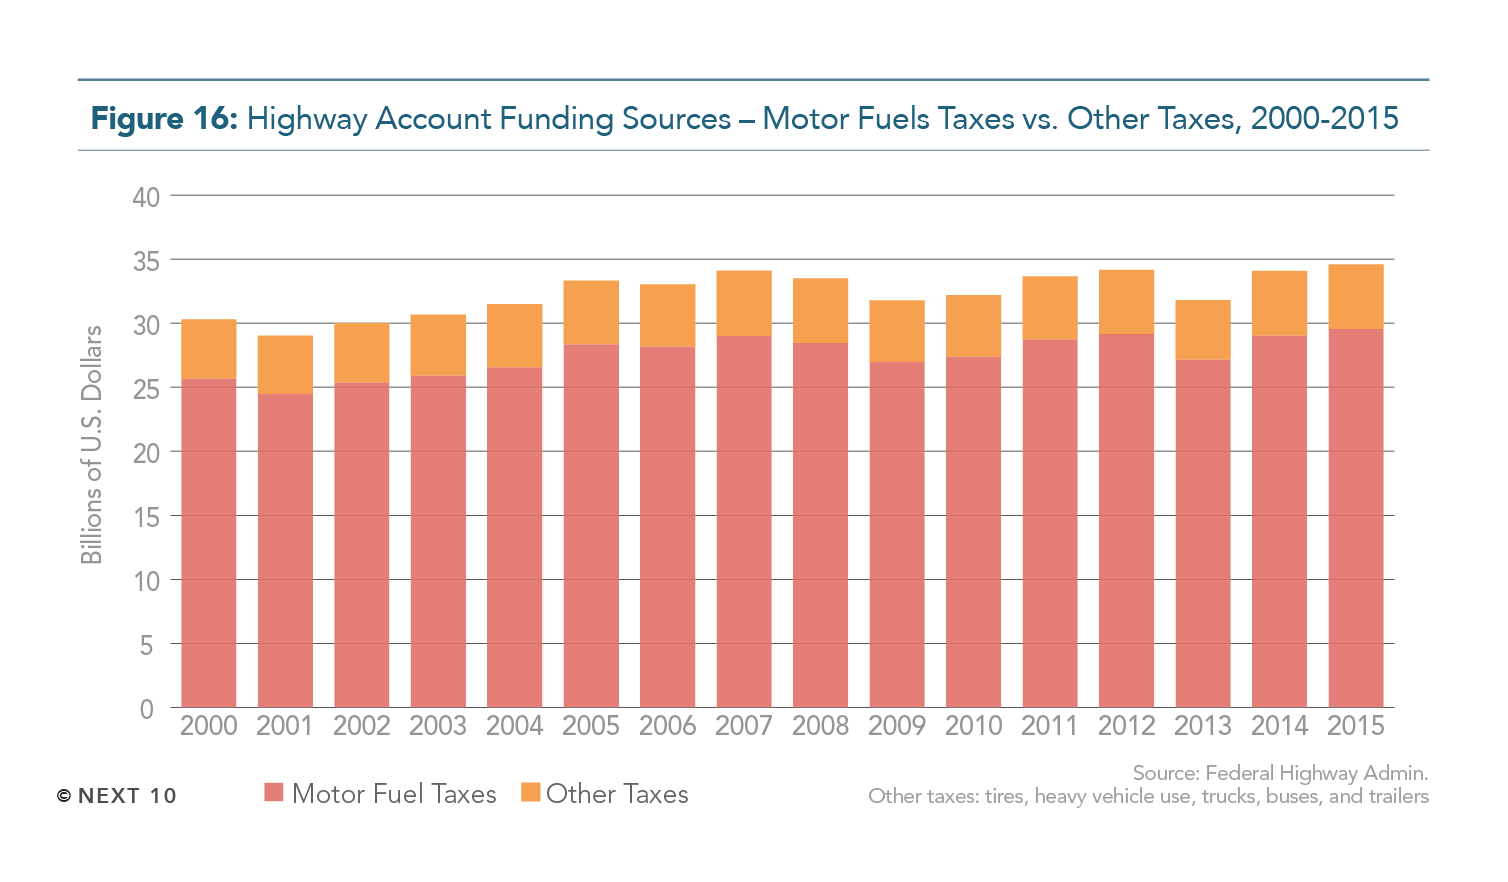
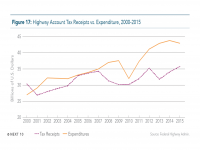
- Motor Vehicle Fuel Tax revenue has been on a decline—inflation-adjusted fuel tax revenue declined 20 percent from 2010 to 2015.
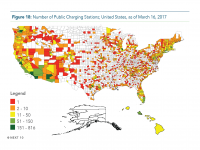
Zero Emission Vehicle Adoption
- California has sold almost half of all the nation’s zero emission vehicles (ZEVs) to date.
- Almost 530,000 zero emission vehicles have been sold as of the end of 2016 in the United States; almost 258,000 of those ZEVs were sold in California alone.
- If the state meets its 2025 goal of putting 1.5 million ZEVs on the road, CARB estimates it would displace 1.5 billion gallons of motor fuels.
- If state gasoline and federal excise taxes were to remain unchanged, the displacement would mean a revenue loss of $572 million and $276 million, respectively.
Alternative Approaches to Vehicle Fuel Tax Based Revenue
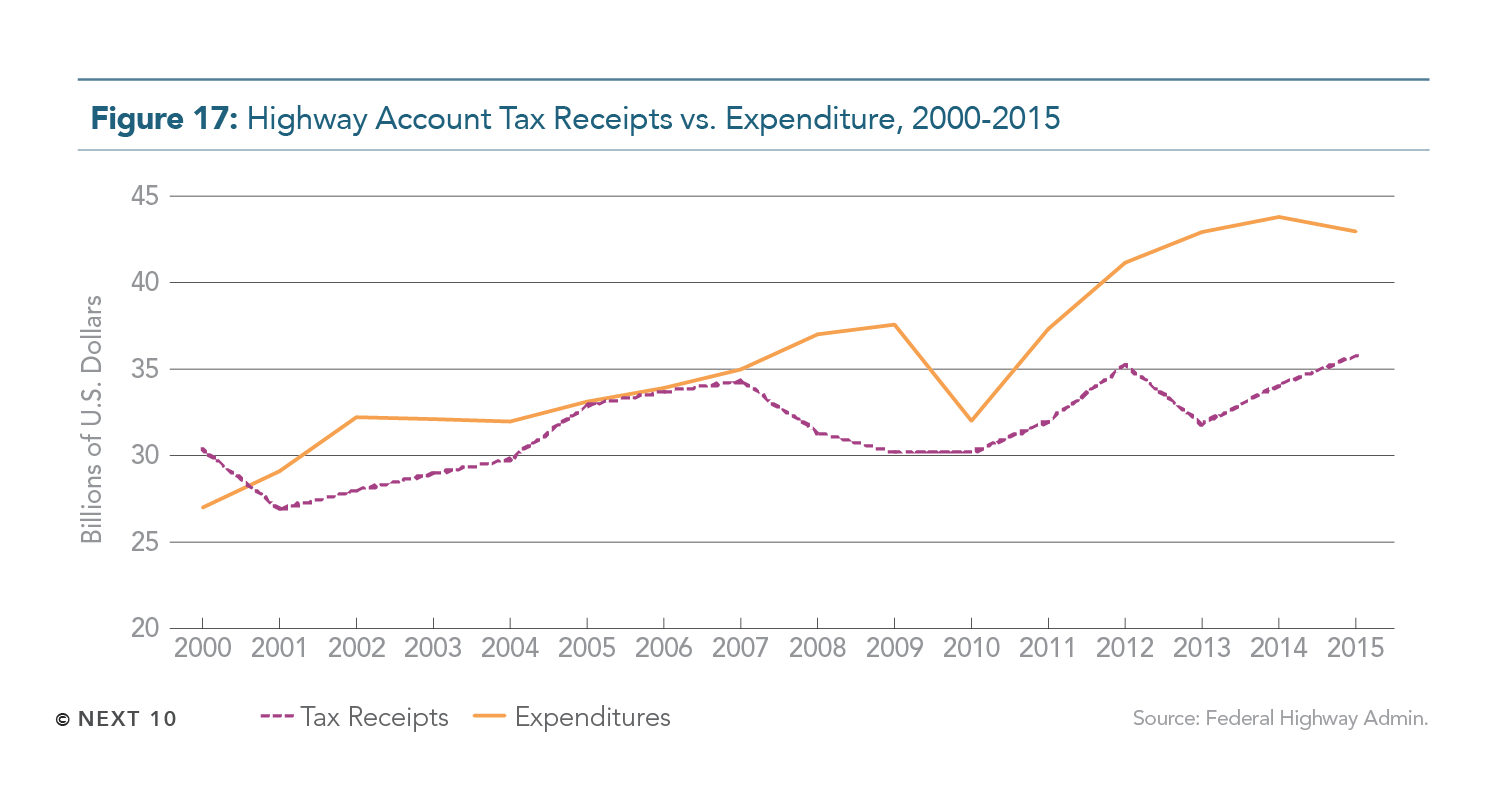
As both California road conditions and fuel tax revenue continue to decline, this funding gap will be further exacerbated by continued fuel efficiency improvements and broader adoption of ZEVs. The new transportation package (SB 1) helps create new revenue opportunities for transportation funding, but further measures will be necessary in order to close the gap in an evolving vehicle marketplace. Alternative approaches to help bridge the gap in funding include:
- Flat rate fees—simplest and easiest to implement but ignores road usage and externalities like congestion cost
- Fuel taxes indexed to inflation—SB 1 made this improvement by indexing new state taxes and fees to inflation, but the federal gas excise tax has remained unchanged since 1993
- Fund toll roads through private-public-partnerships—this has the potential to be efficient but comes with risk; private company interests may not align with public priorities and revenues may decline in times of recession
- Mileage based user tax—could help account for usage in a more comprehensive and equitable way, but comes with implementation hurdles and privacy concerns
Next 10 owns the copyright to all graphics in this section, and they are available for download and limited use, subject to our Terms of Use. Please contact Next 10 at info@next10.org with any questions.