Publications
Missing the Mark: Examining the Shortcomings of California's Housing Goals
New brief finds California's housing goals are exacerbating the housing crisis, and at the current pace of development, certain jurisdictions in California will not meet their low-income housing production targets for more than 1,000 years.
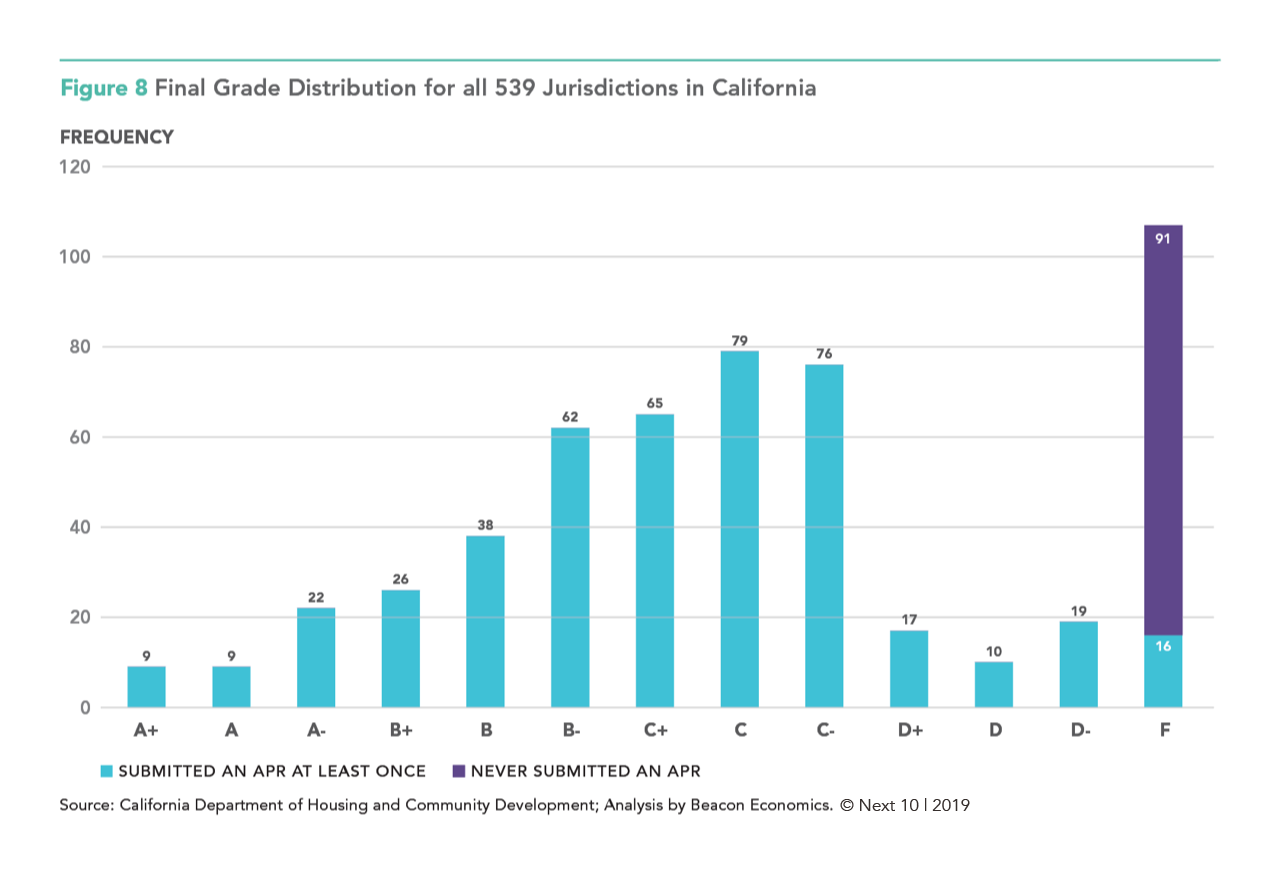
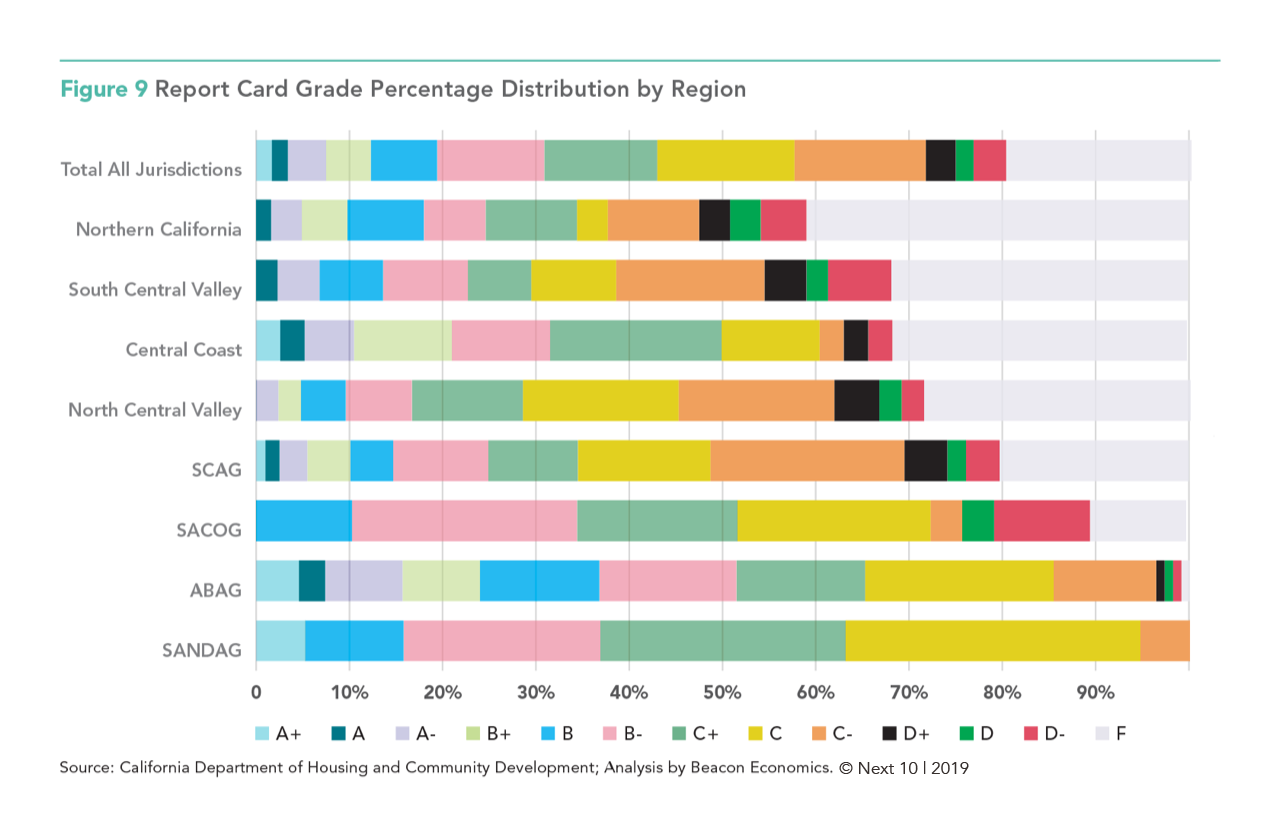
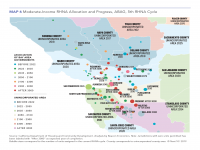
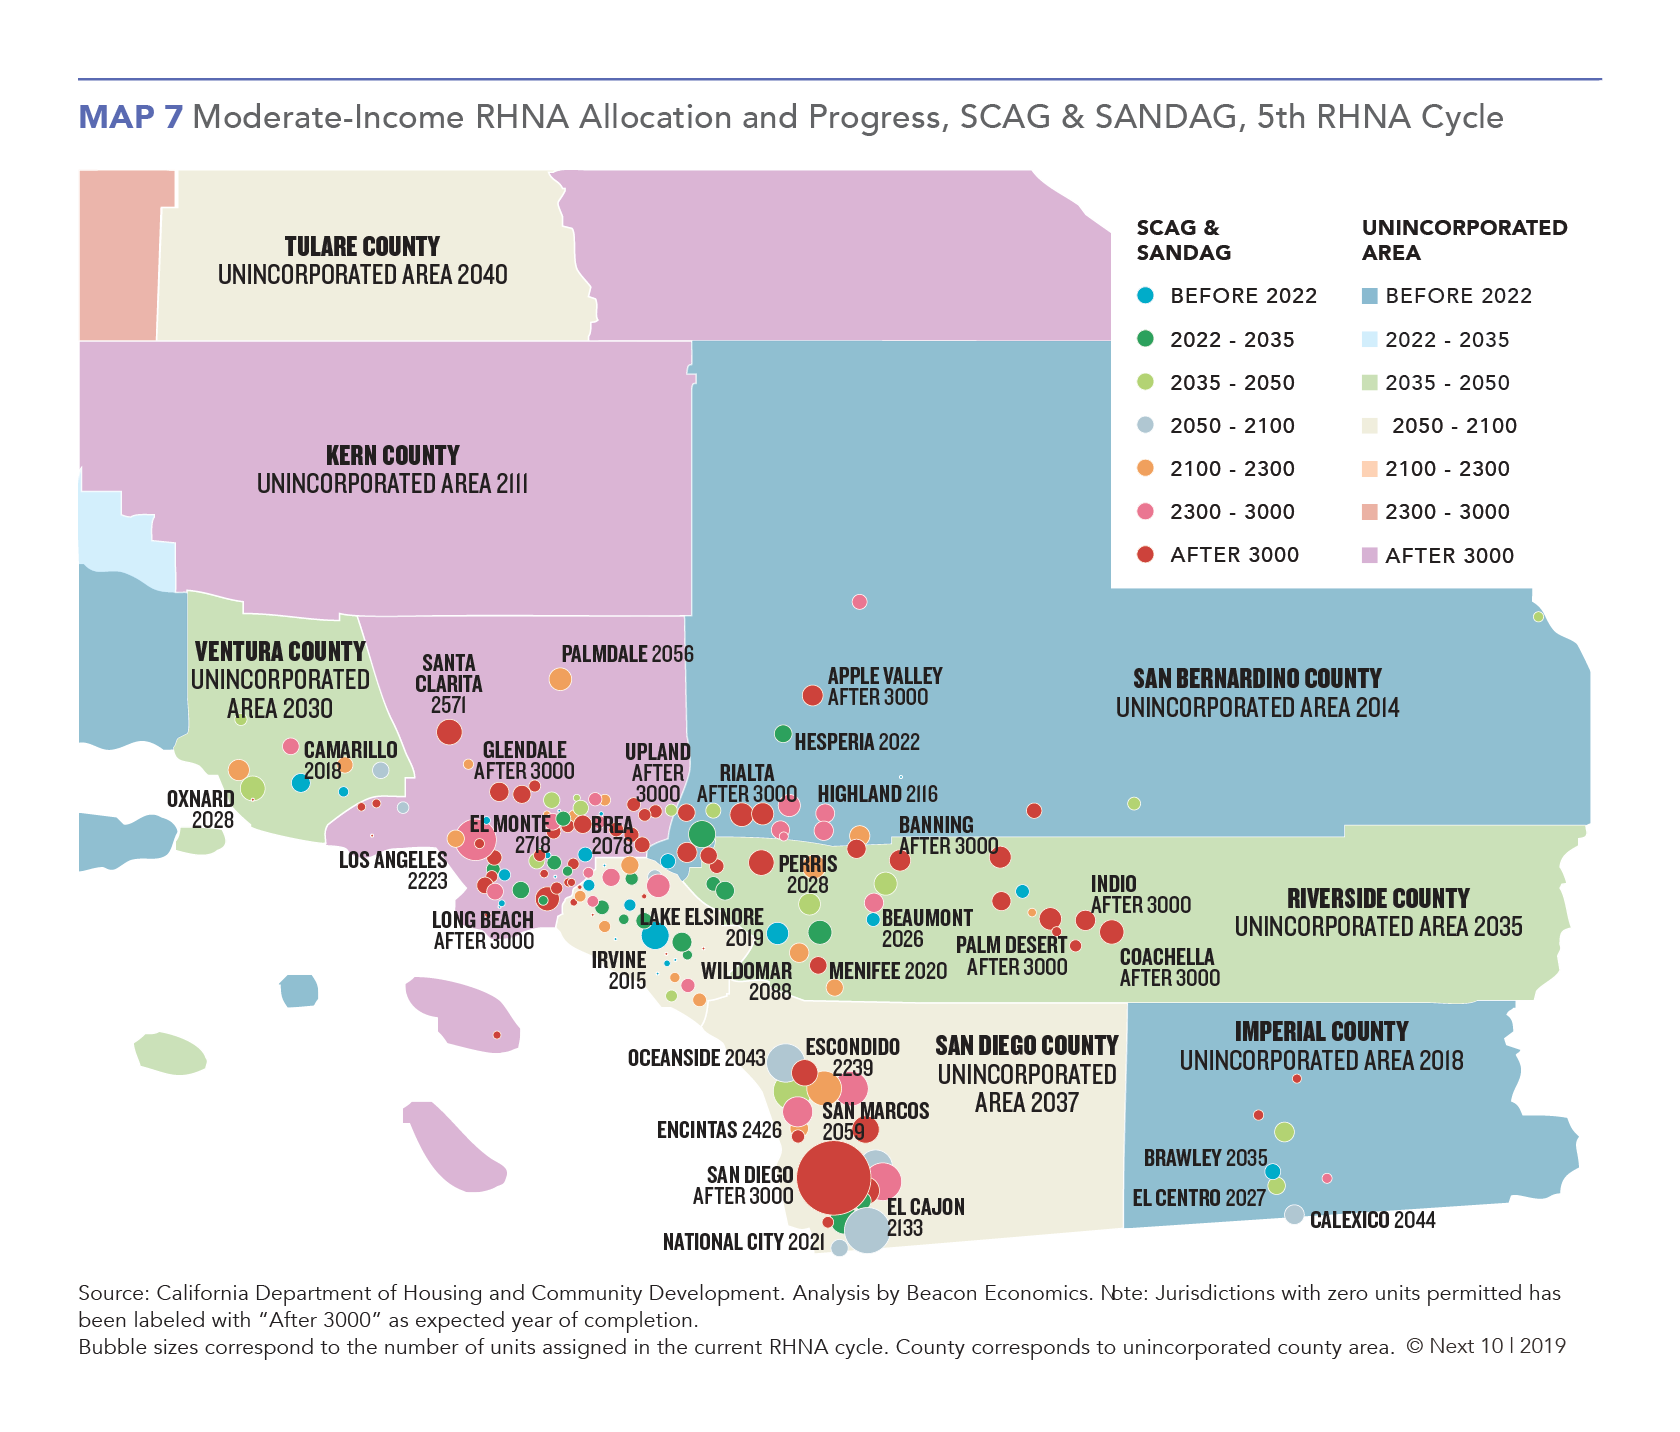
The brief grades the state’s 539 jurisdictions on progress toward meeting their current Regional Housing Needs Assessment (RHNA) goals. RHNA targets, updated every five to eight years, determine the amount of housing units at each income level that every California jurisdiction needs to permit each cycle. The study finds most regions are chronically behind on permitting new housing units, and 100 of the 539 jurisdictions have not been participating in the reporting process at all. The jurisdictions are separated into four Council of Governments (COGs) and four broader regions.
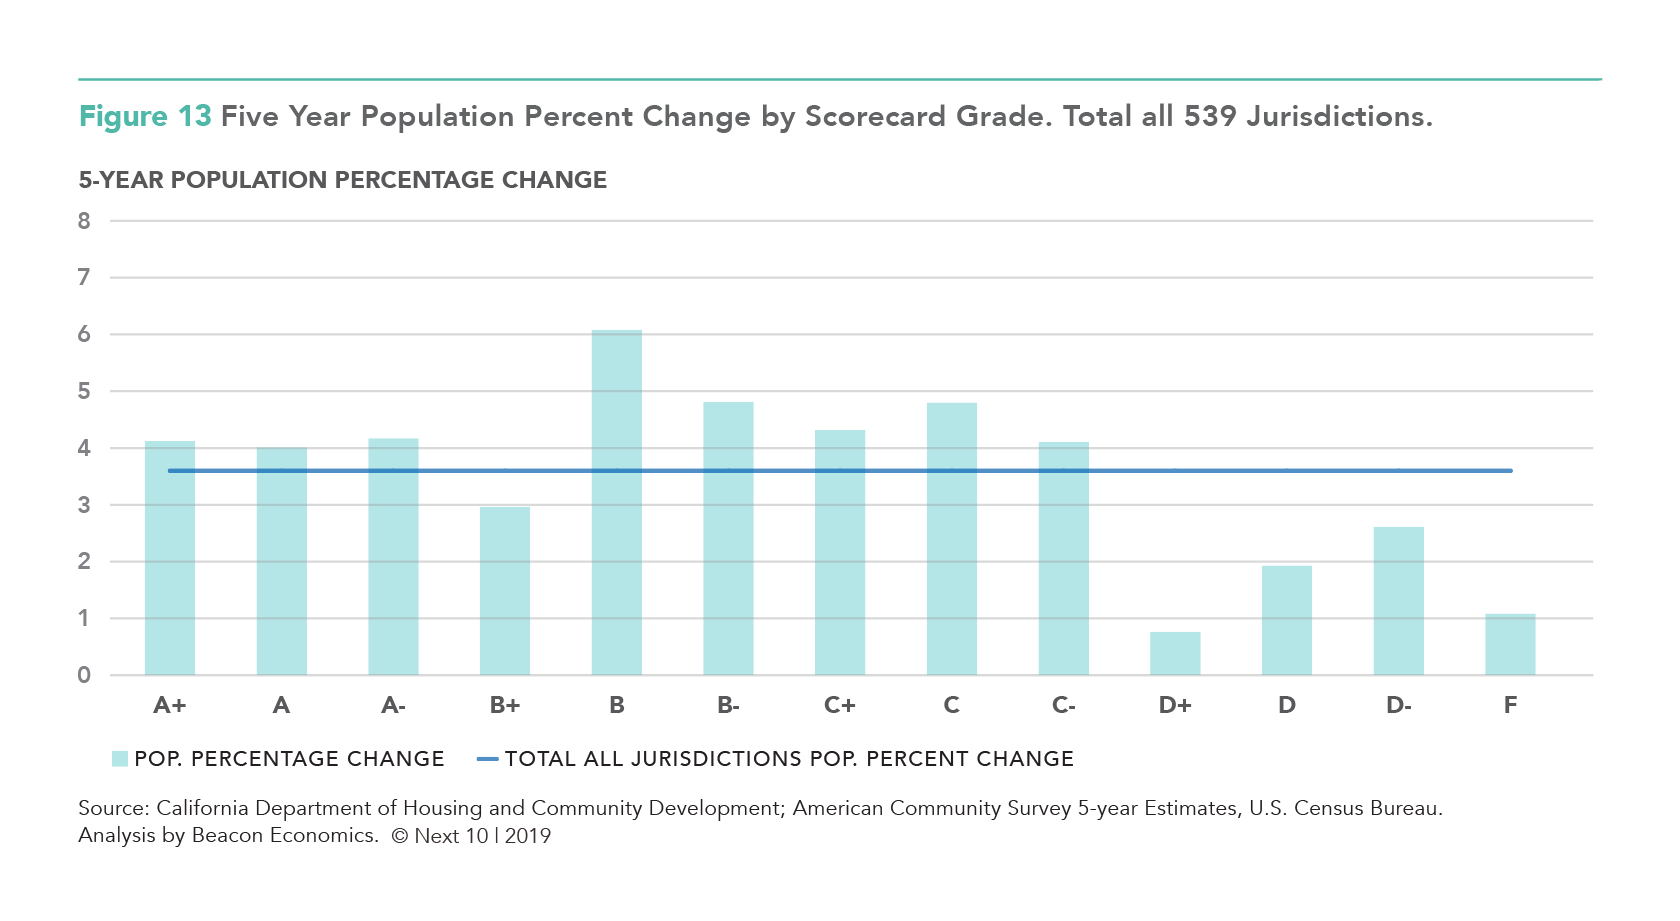
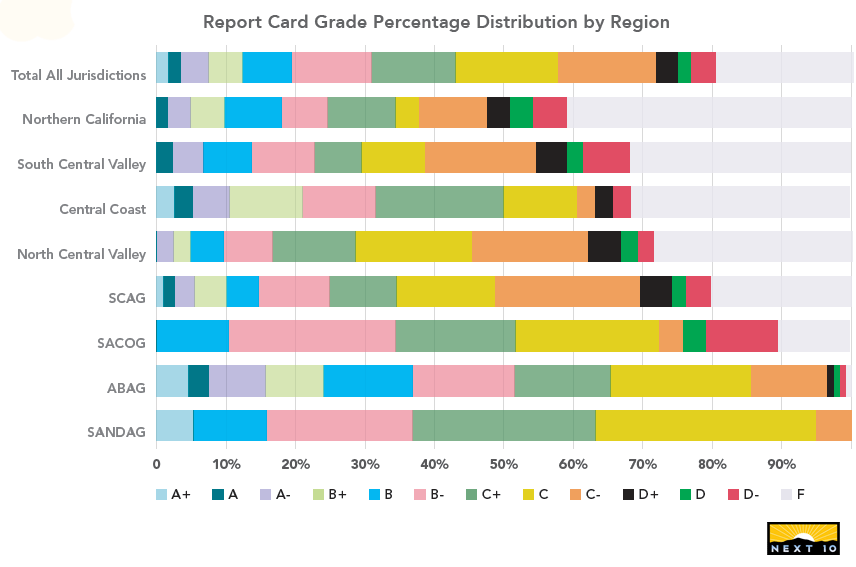
While the brief provides a detailed analysis of performance against housing targets, what is most striking from the findings is that the targets themselves may be lacking. Across California, some jurisdictions are earning high grades only because they have very low targets for housing units relative to local population, and performance grades actually decreased as the number of units assigned relative to population increased.
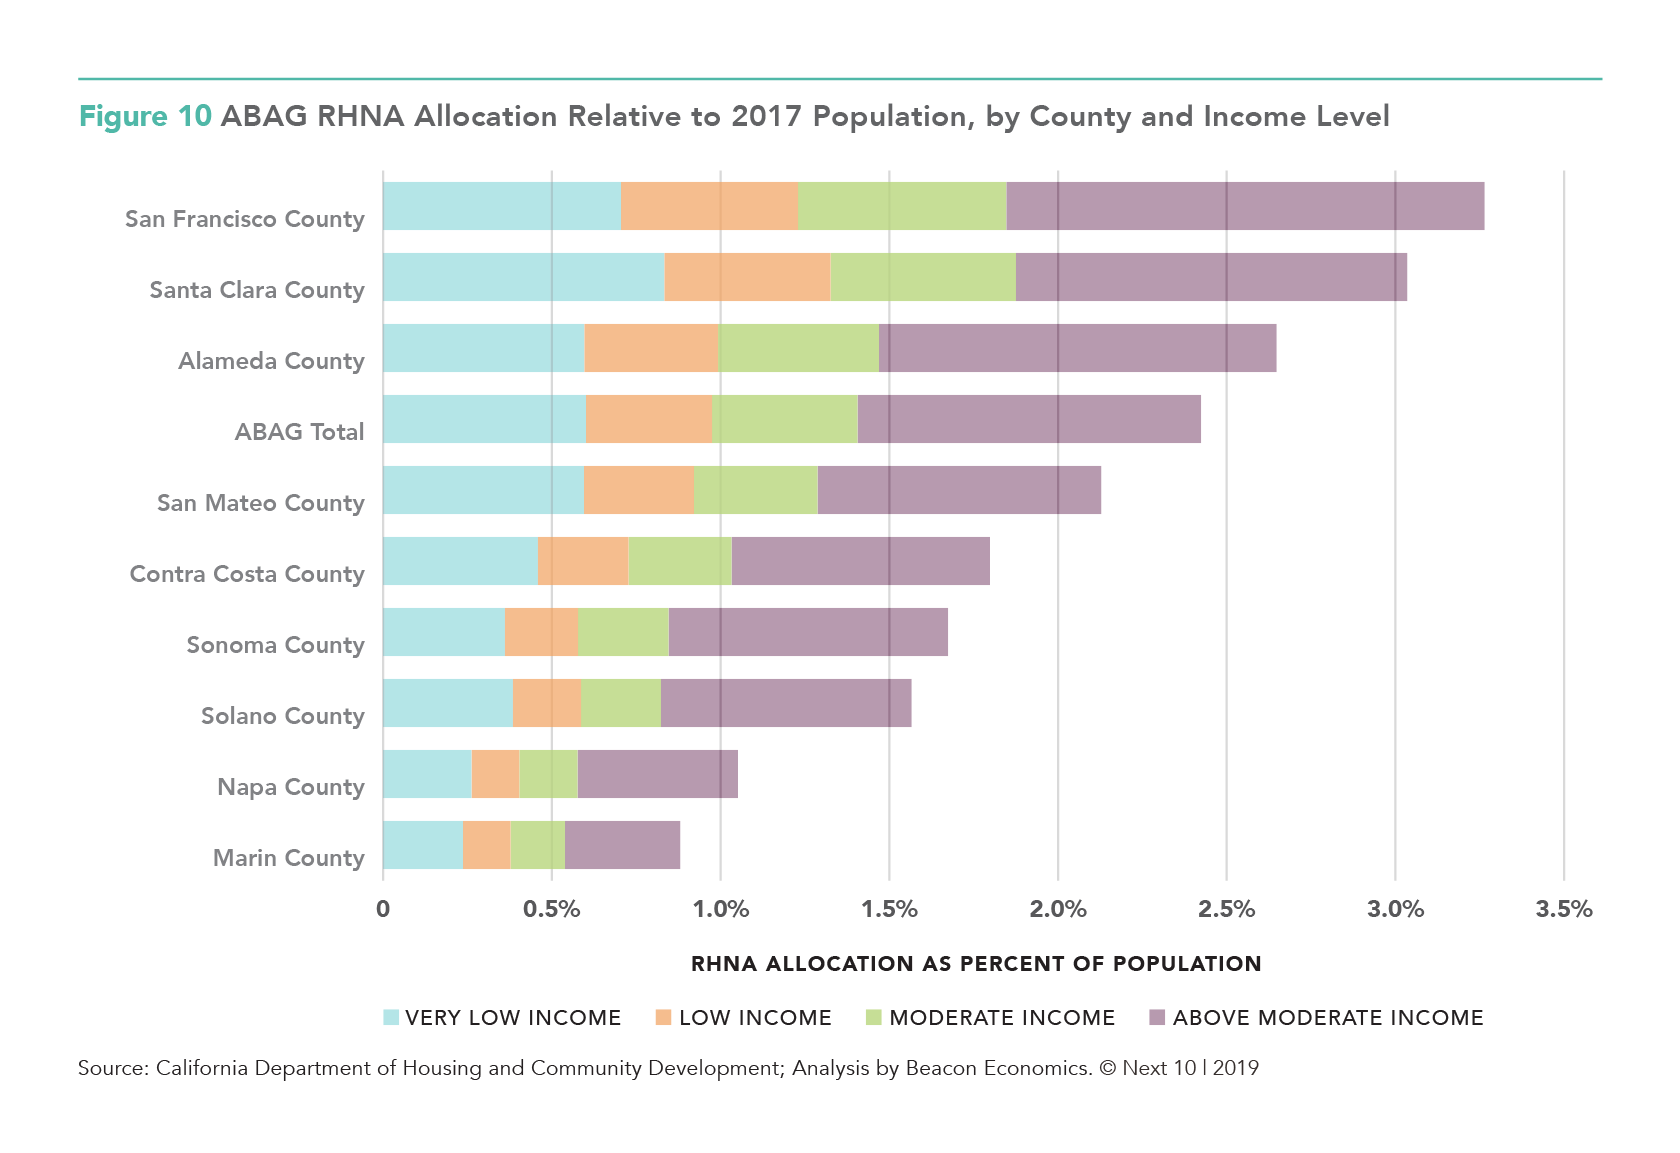
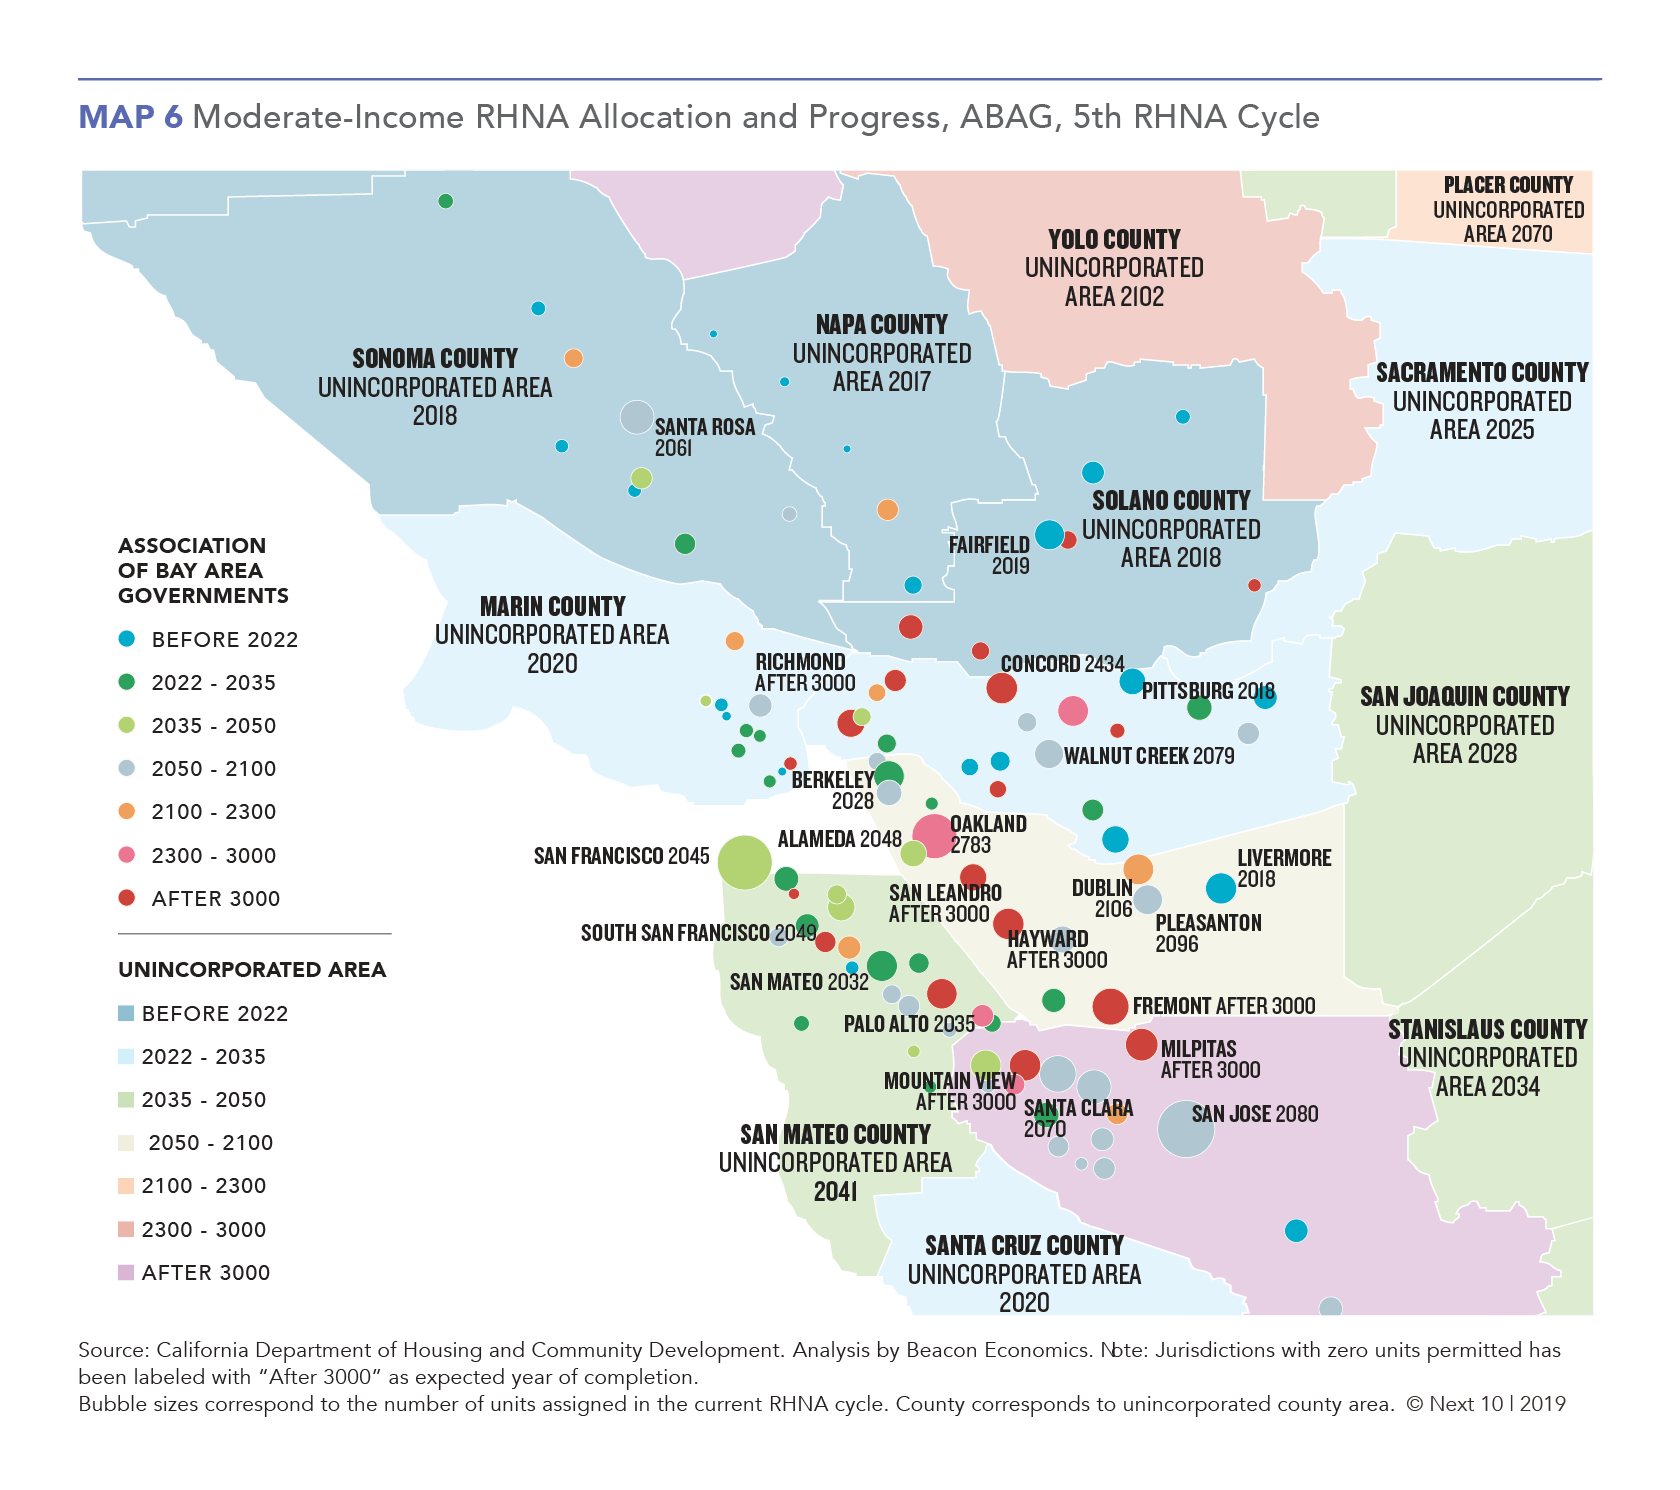
The nine jurisdictions that earned an A+ on RHNA progress had an average of only 0.7 units assigned per 100 persons in the jurisdiction's population. On the other hand, jurisdictions that earned an F had an average of 3.3 units assigned per 100 persons. In the Bay Area, Marin and Napa counties—which both received a B+—have the lowest total RHNA allocation as a percentage of 2017 population (0.9% and 1.1%, respectively) compared to the Association of Bay Area Governments (ABAG) average of 2.4 percent. Beverly Hills in Los Angeles County also received an A because they built all three of the units allocated to them over an eight-year period, despite being forecasted to add an estimated 300 households and 3,400 jobs by 2020.
Next 10 owns the rights to this publication. Any usage of content from this publication is subject to our Terms of Use.
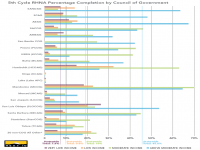

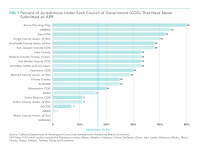
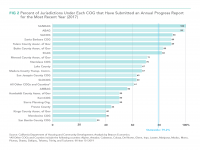
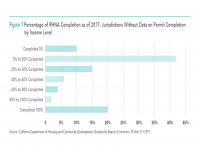
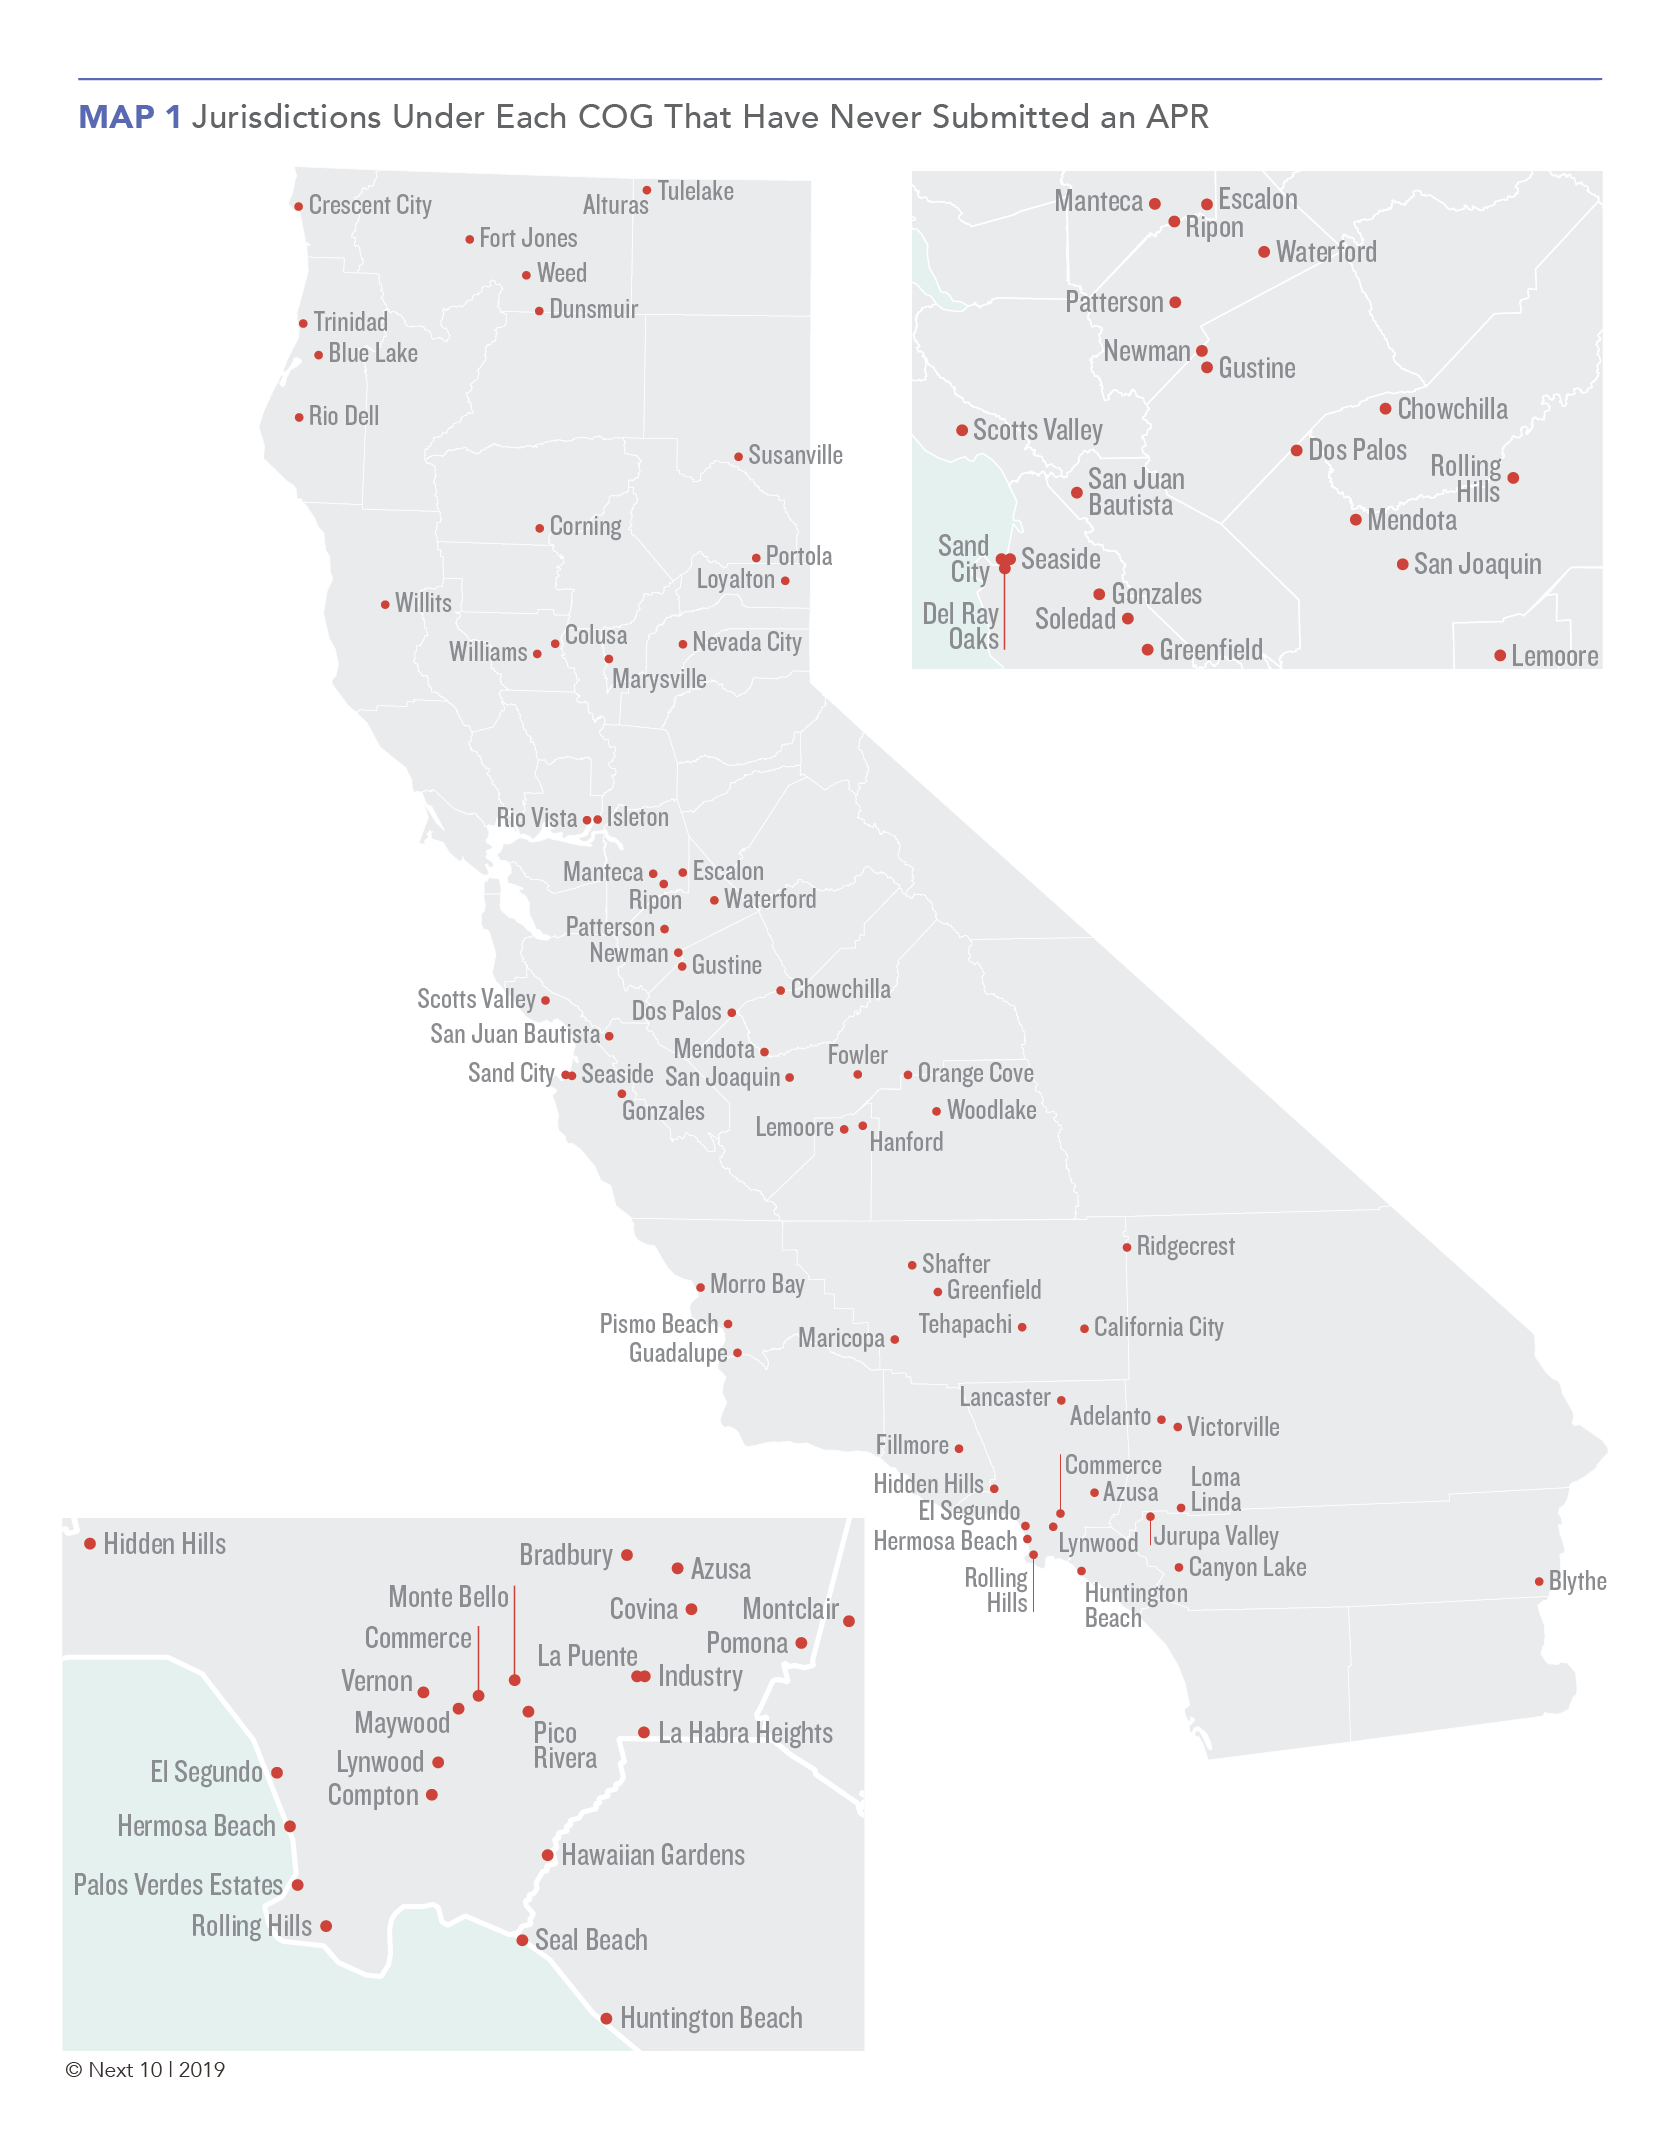
- The study finds a chronic lack of participation in the assessment process—with 100 of the state’s 539 jurisdictions having not filed an annual progress report (APR).
- San Diego Association of Governments (SANDAG) and Butte County Association of Governments are the only COGs where all jurisdictions have submitted an Annual Progress Report (APR) at least once since 2013.
- The lack of reporting may be due to local capacity constraints, as the majority of jurisdictions that have never submitted an APR are lower-income areas of southeast Los Angeles County and the Central Valley.
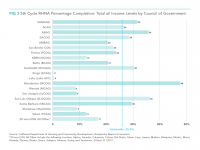
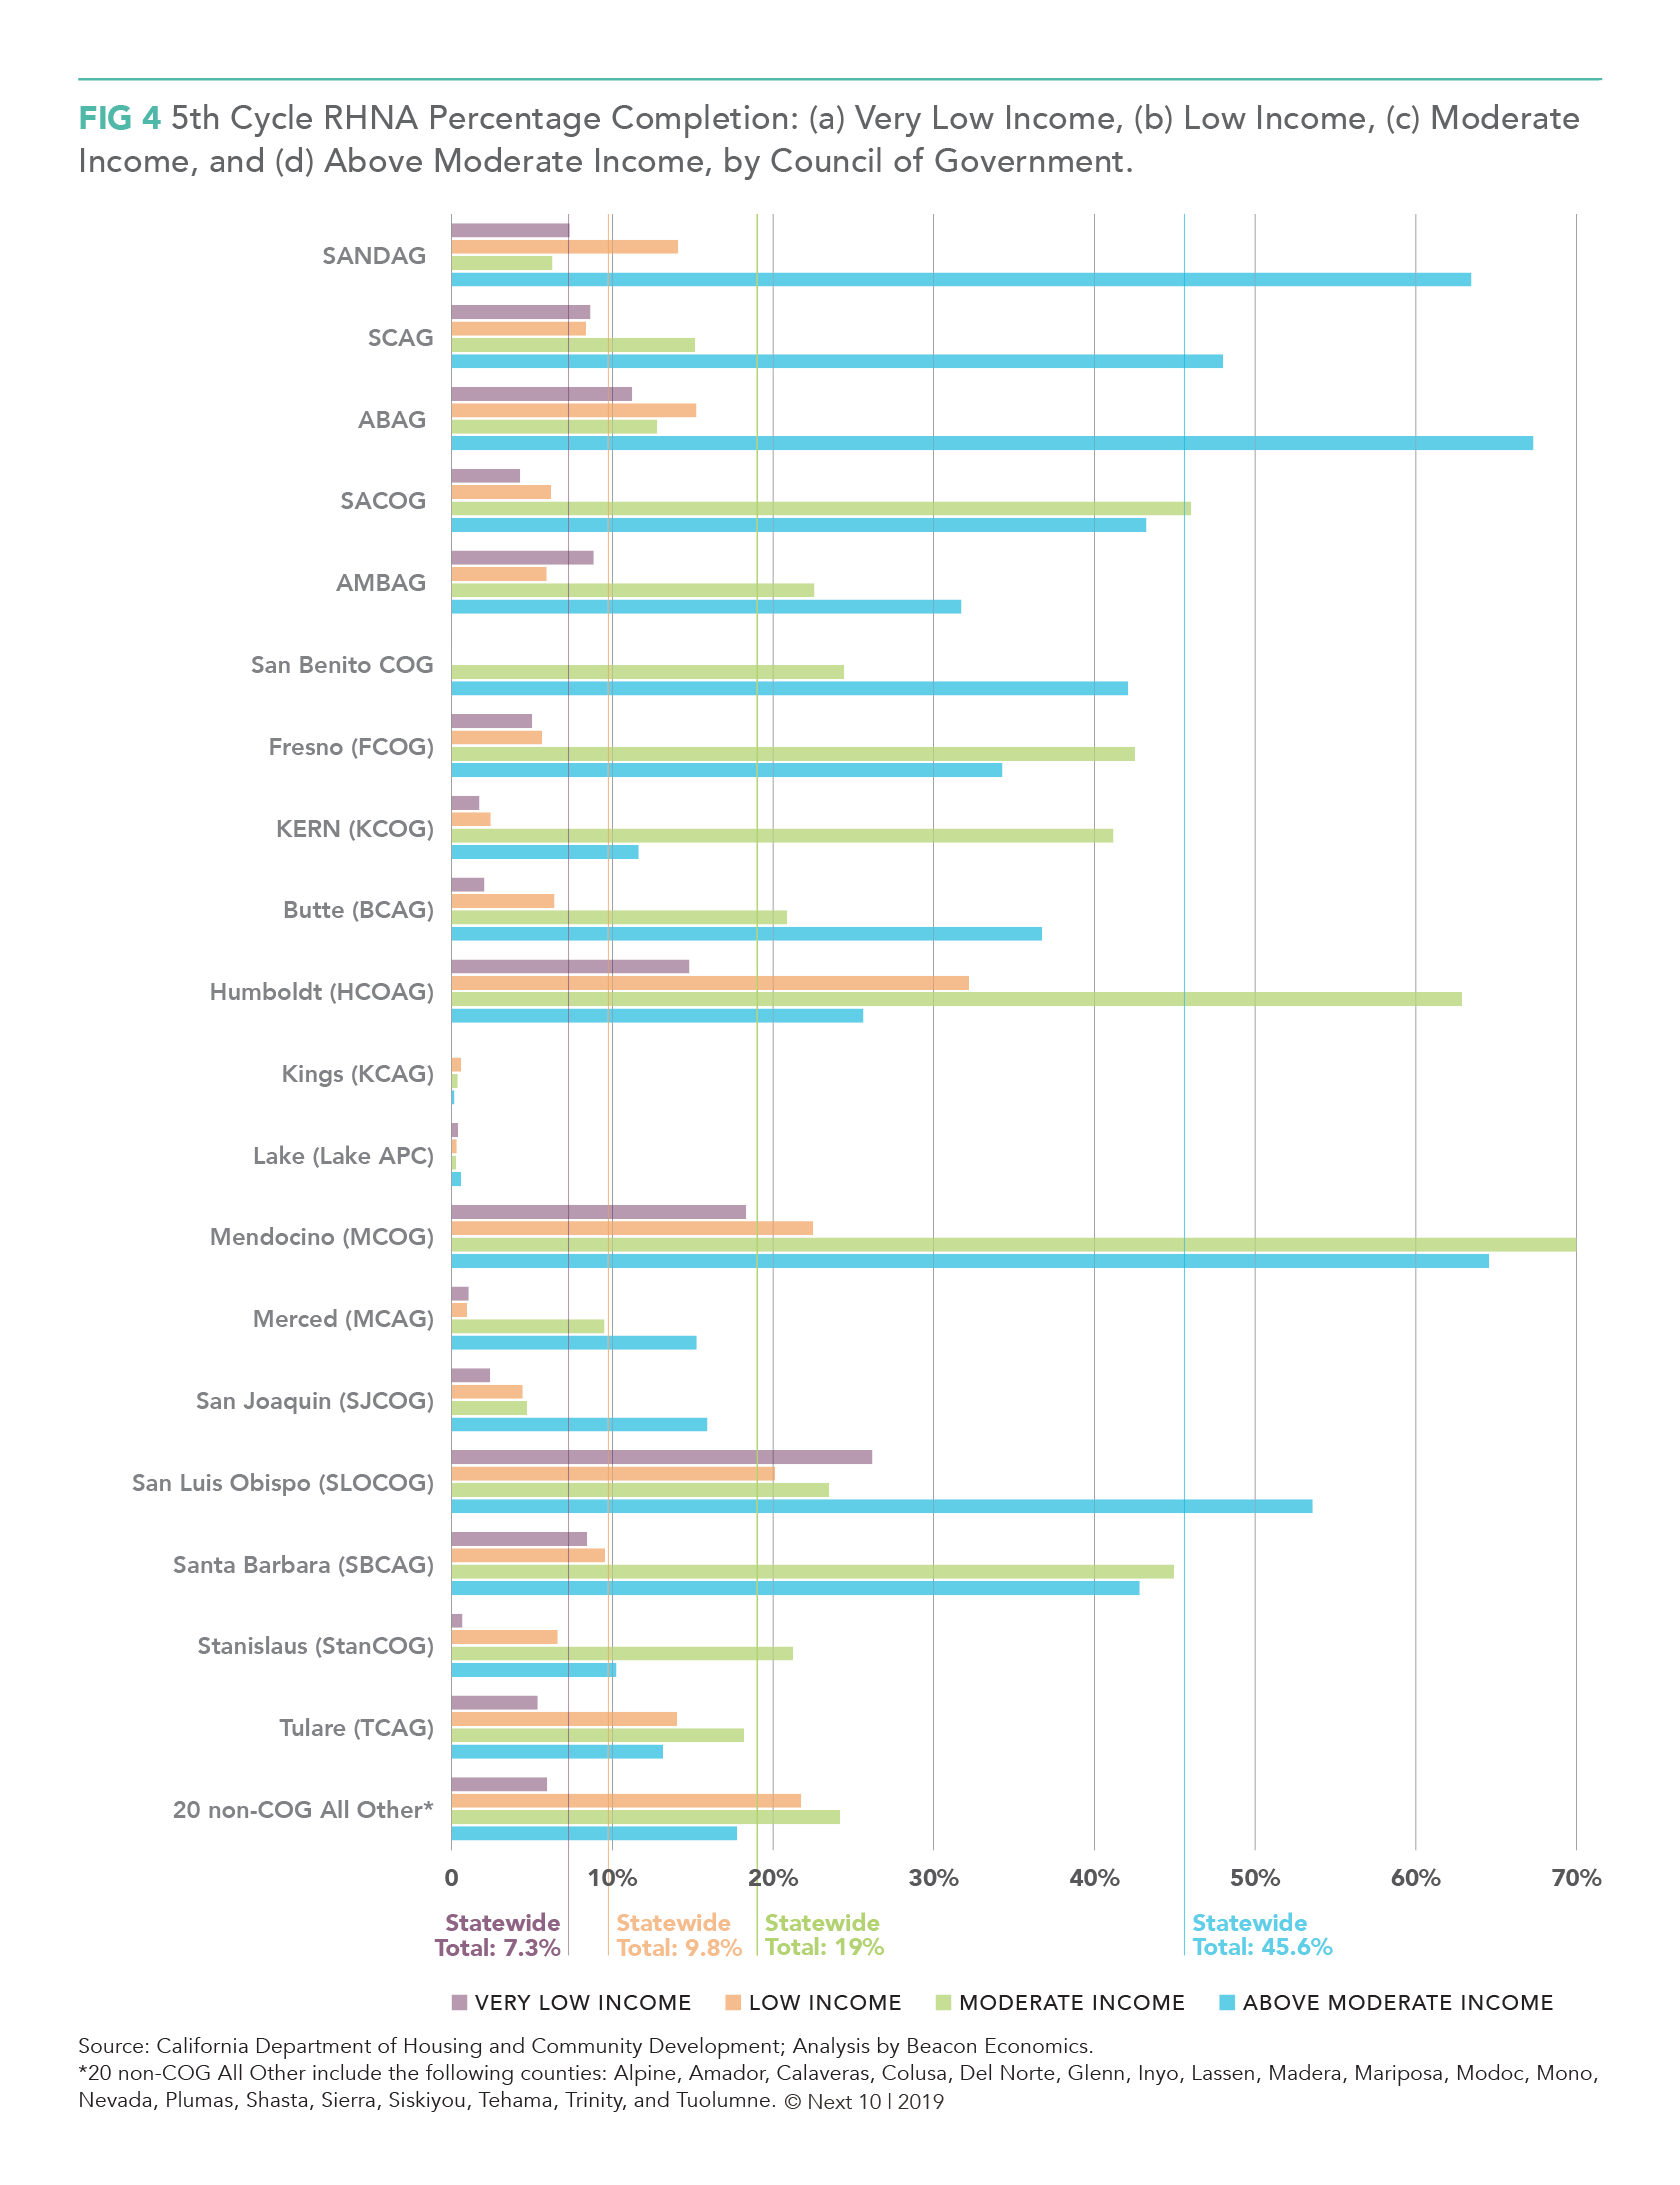
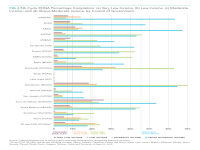
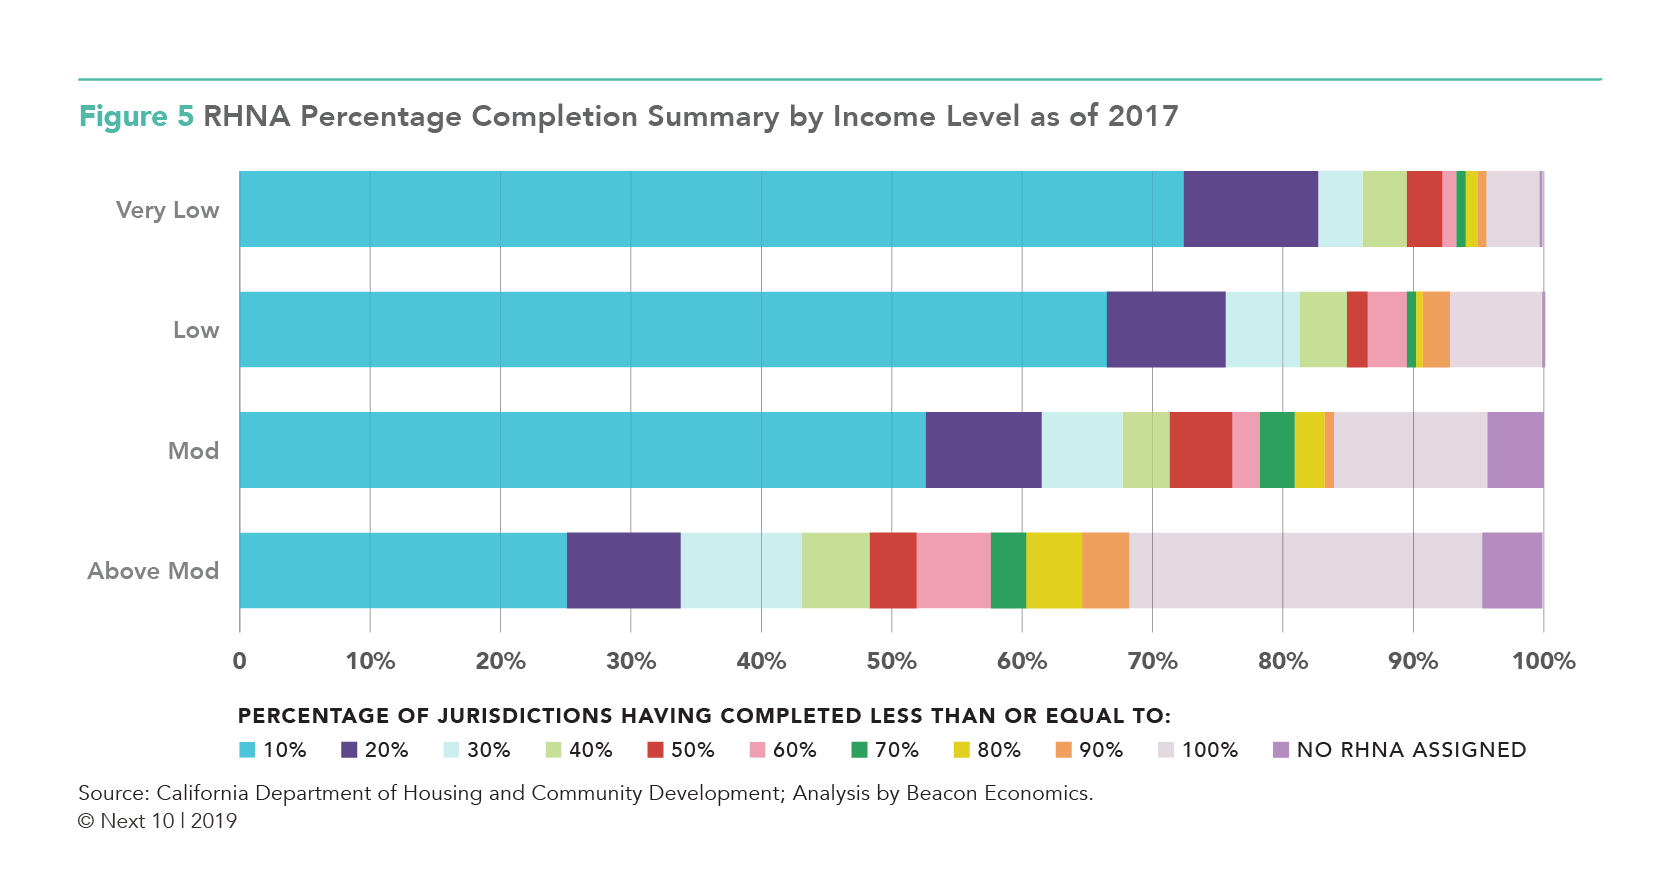
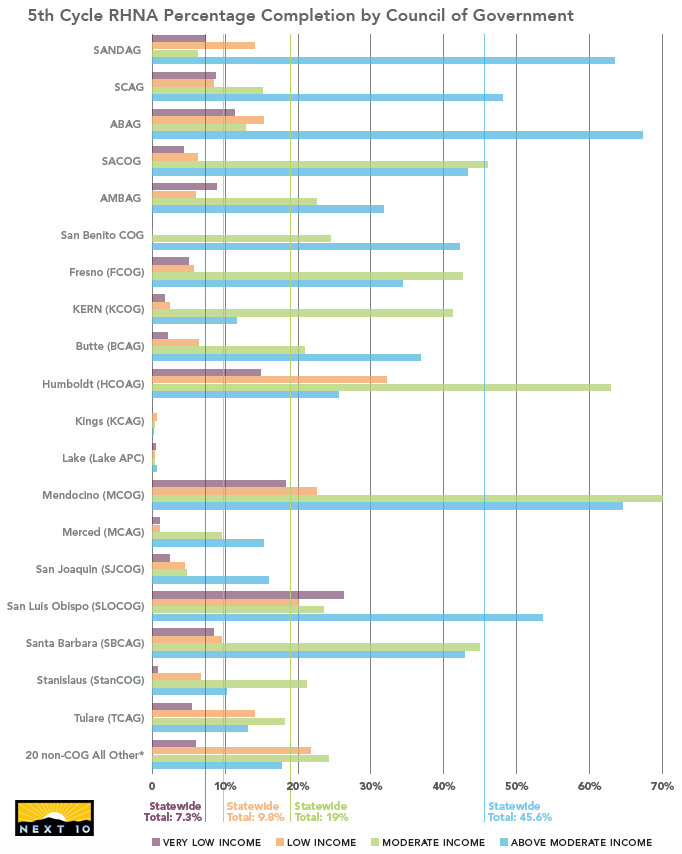
- Only 25.9 percent of the allocated units state-wide have been permitted across all income levels, even though the current RHNA cycle is more than half over.
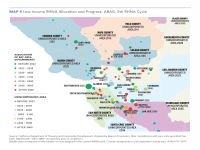
- The percentage permitted is progressively worse the lower the income level for housing units.
- 45.6 percent of above moderate-income units have been permitted, whereas only 19 percent of moderate, 9.8 percent of low-income, and 7.3 percent of very low-income units have been permitted.
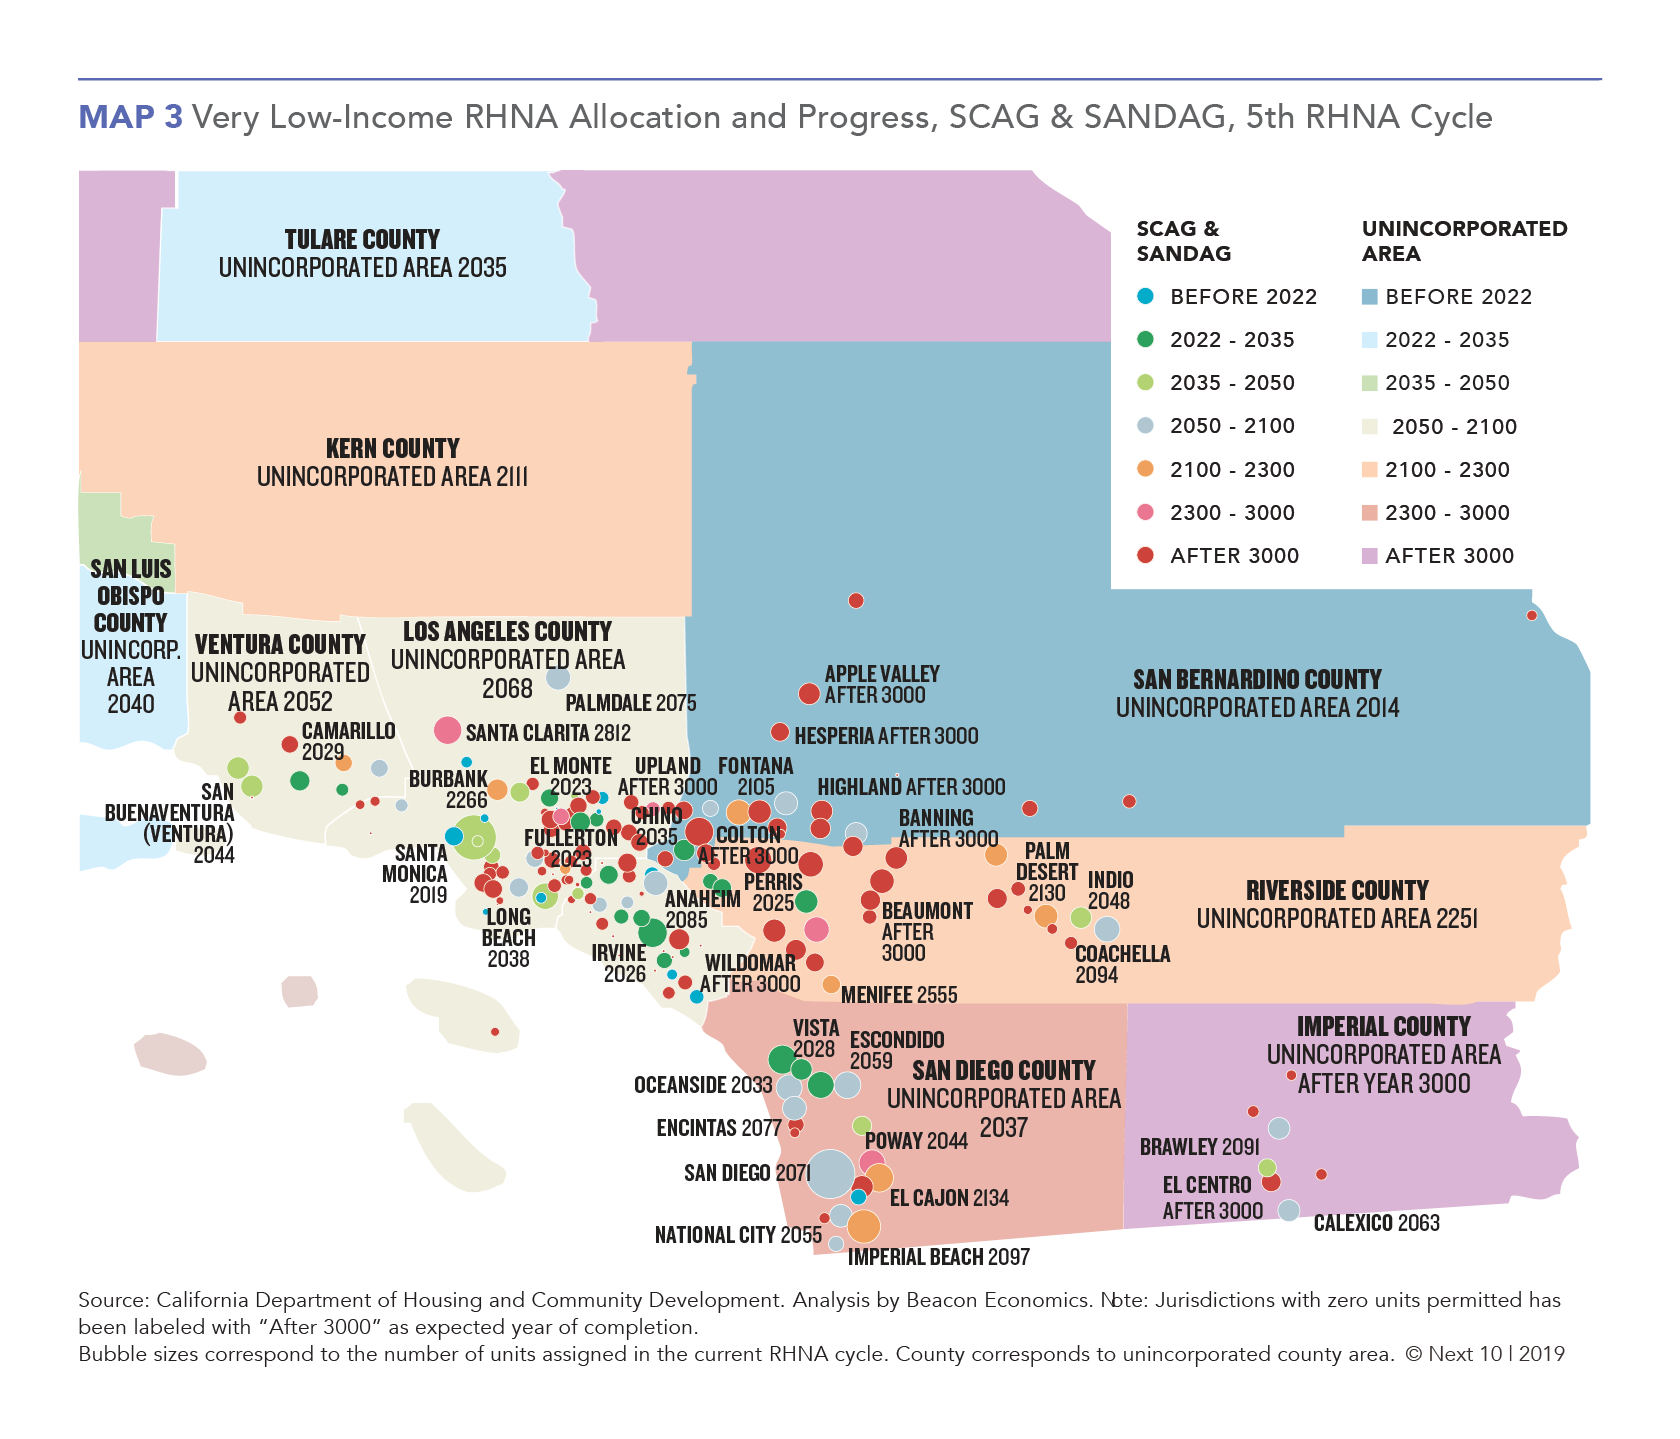
- 52 percent of jurisdictions that have submitted an APR have permitted zero units for the very low-income category.
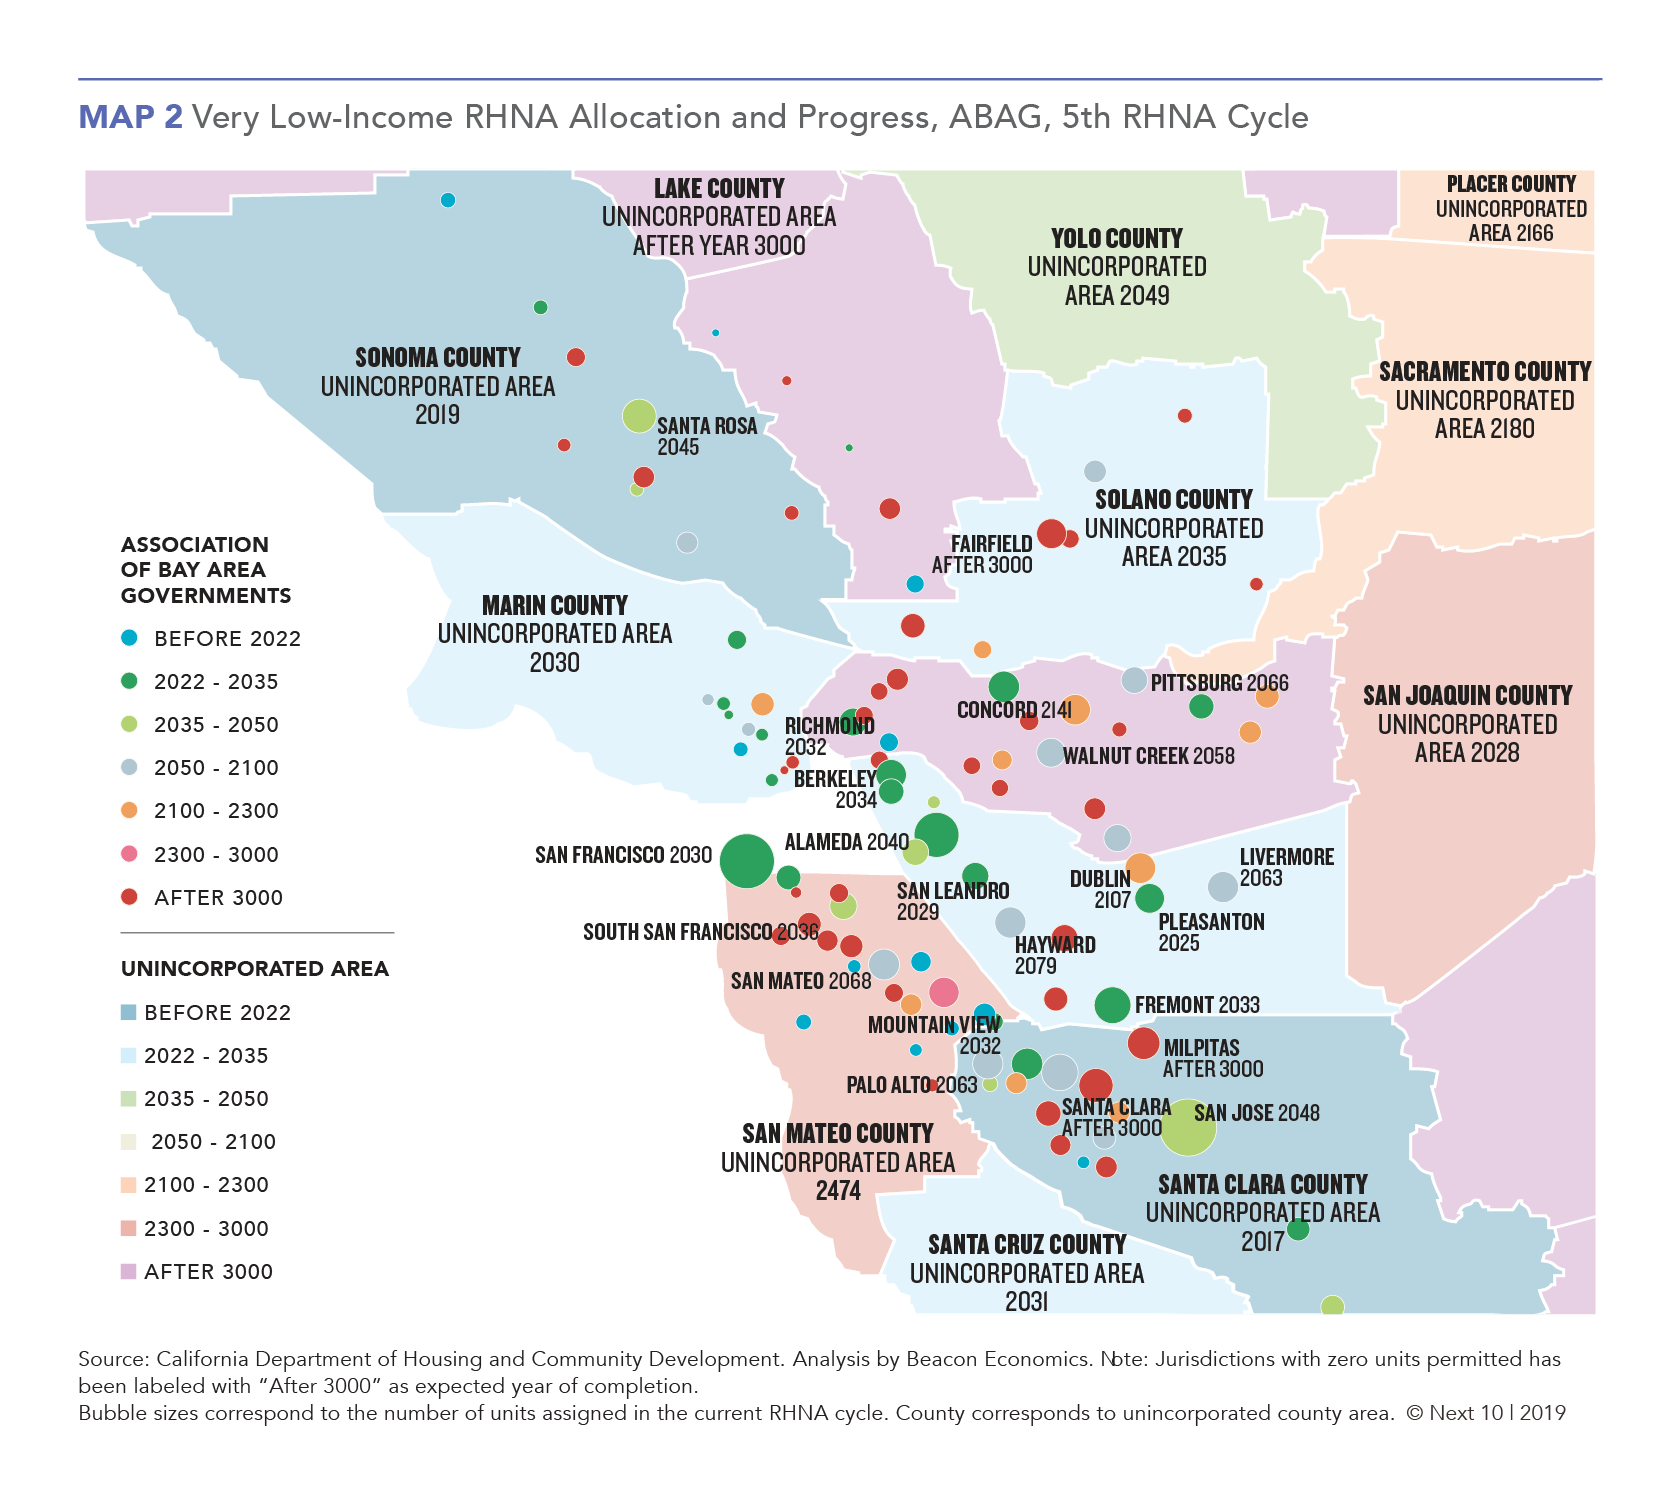
- At the current pace of very-low income housing permitting, San Francisco and Oakland will meet their very low-income goal around 2030, Los Angeles and Long Beach won’t meet their goals until closer to 2040, Palo Alto won’t hit theirs until 2063, while Santa Clara won’t hit their target until beyond 2500.
- At the above moderate-income level, San Francisco, Oakland, and San Jose will meet their goals by the end of 2019, while Riverside won’t meet their goal until after 2200, based on current permitting pace.
- Some jurisdictions are over-building higher-income housing, while not building lower-income housing.
- For example, Costa Mesa in Orange County received a RHNA allocation of zero moderate and above moderate units but permitted 518, while permitting zero very-low and low-income units, despite having an allocation of one unit each for those two categories.
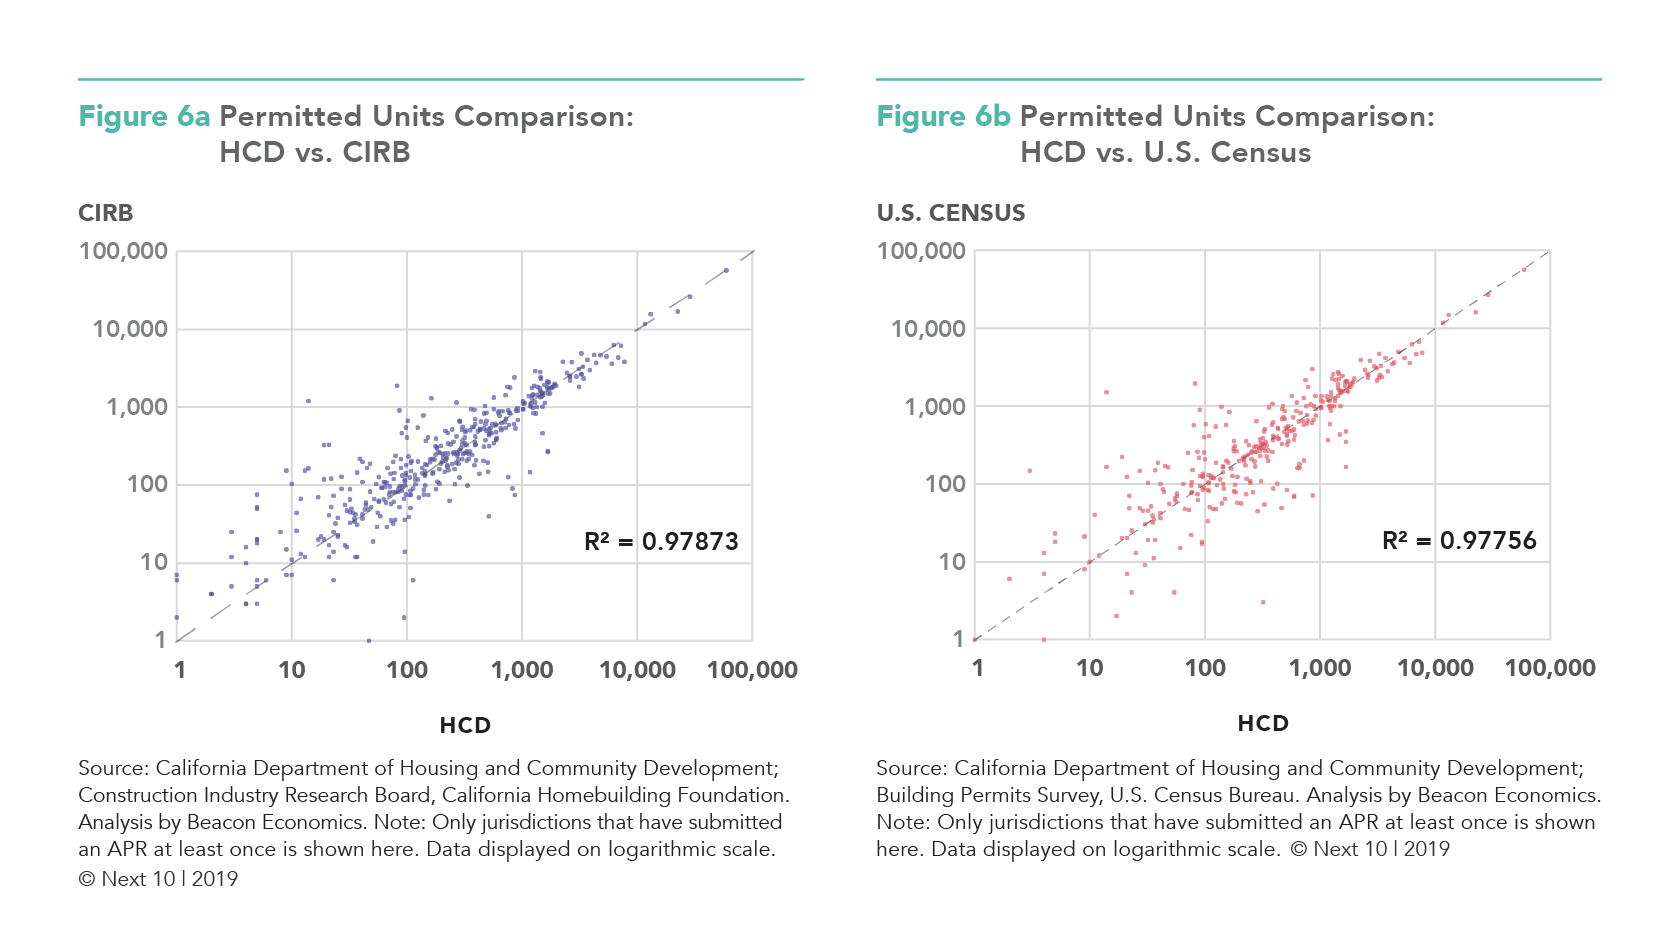
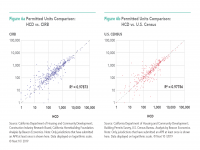
- For the 100 jurisdictions not reporting, the brief uses building permit data to verify that together they have permitted no more than 21.6 percent their assigned RHNA housing units for all income levels.
- For some jurisdictions, particularly higher-income areas, the allocation of RHNA targets is misaligned with population change and job growth projections.
- Across California, grades decreased as the number of units assigned relative to population in 2017 increased.
Next 10 owns the copyright to all graphics in this section, and they are available for download and limited use, subject to our Terms of Use. Please contact Next 10 at info@next10.org with any questions