Publications
Analyzing the Business Case and Consumer Preferences for Fast Chargers in California
Just like gas stations, EV charging infrastructure requires additional sources of revenue to be profitable. Whether it’s a gas station or an EV charging station, co-located services and amenities are needed to improve return on investment. This is a finding of Analyzing the Business Case & Consumer Preferences for Fast Chargers in California, a new report from Next 10 and the Institute for Transportation Studies at UC Davis.
The report includes a survey of over 1,000 EV owners in California which finds that these drivers are willing to pay a premium for more accessible fast public charging, especially if one can charge near other services with little to no wait. Access to other services along with charging is also especially attractive for California EV drivers, and this holds true regardless of access to home charging. Based on these insights, the report includes recommendations on where to place EV charging stations to maximize use and revenue.
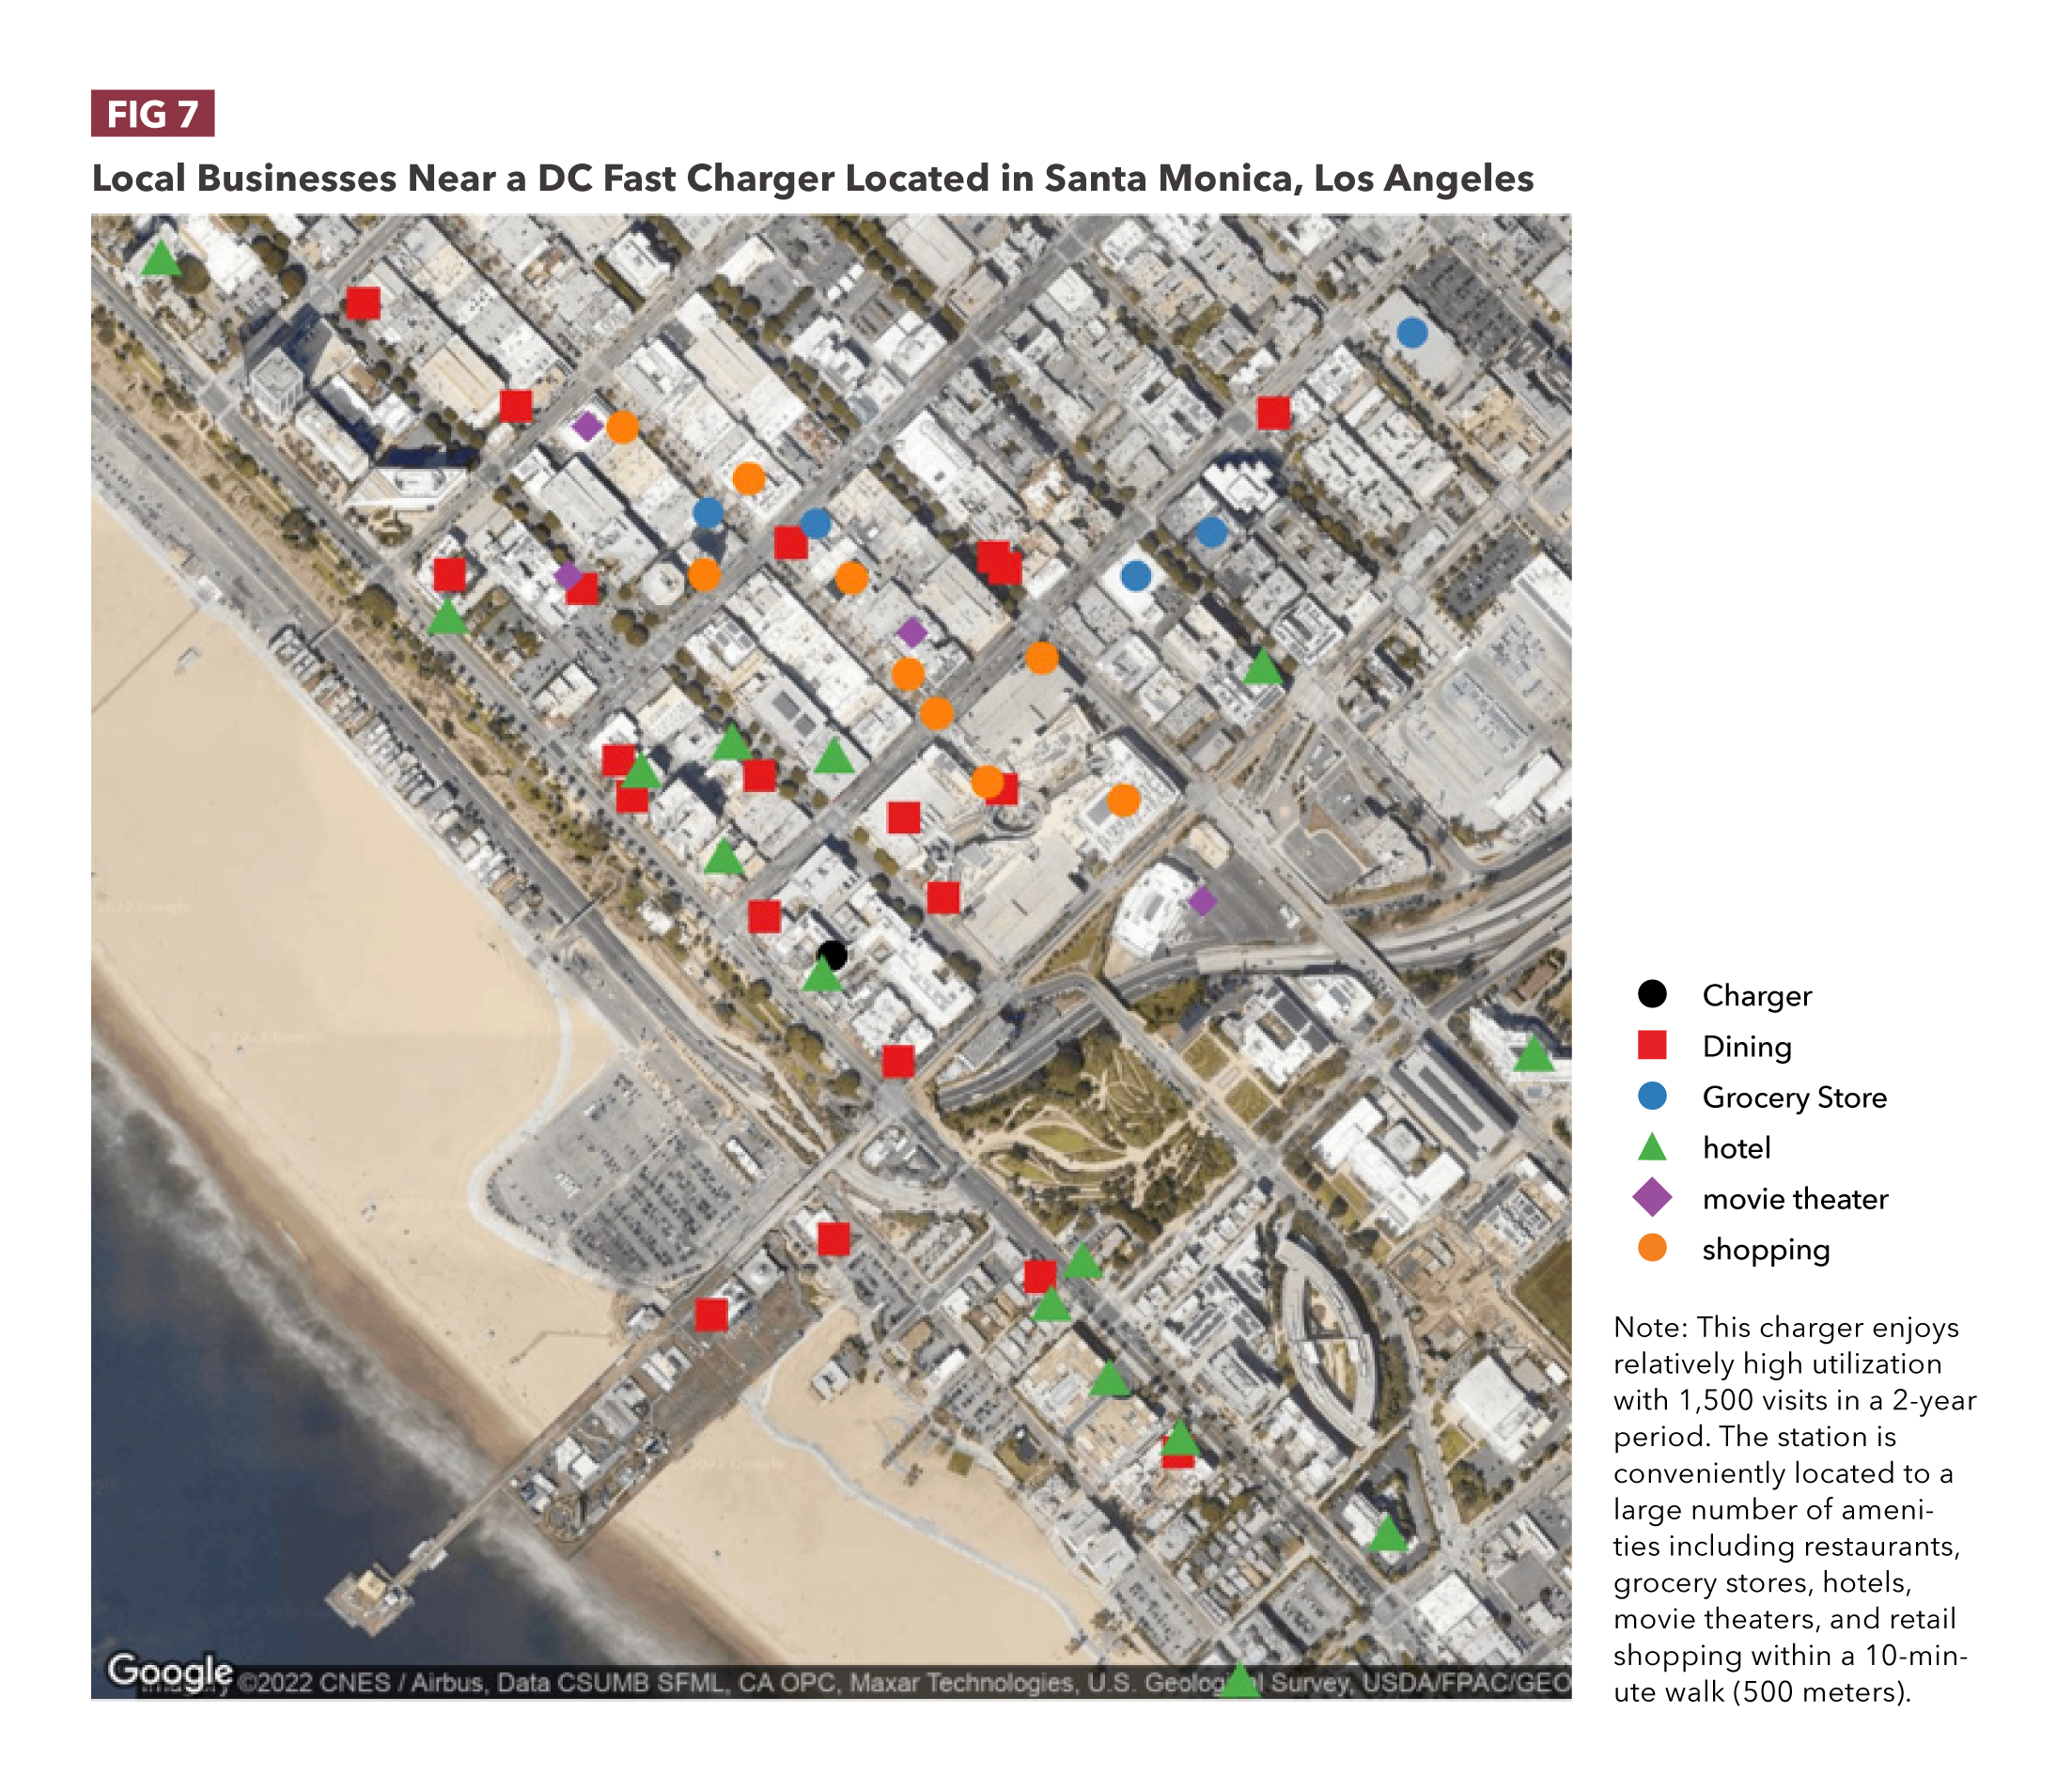
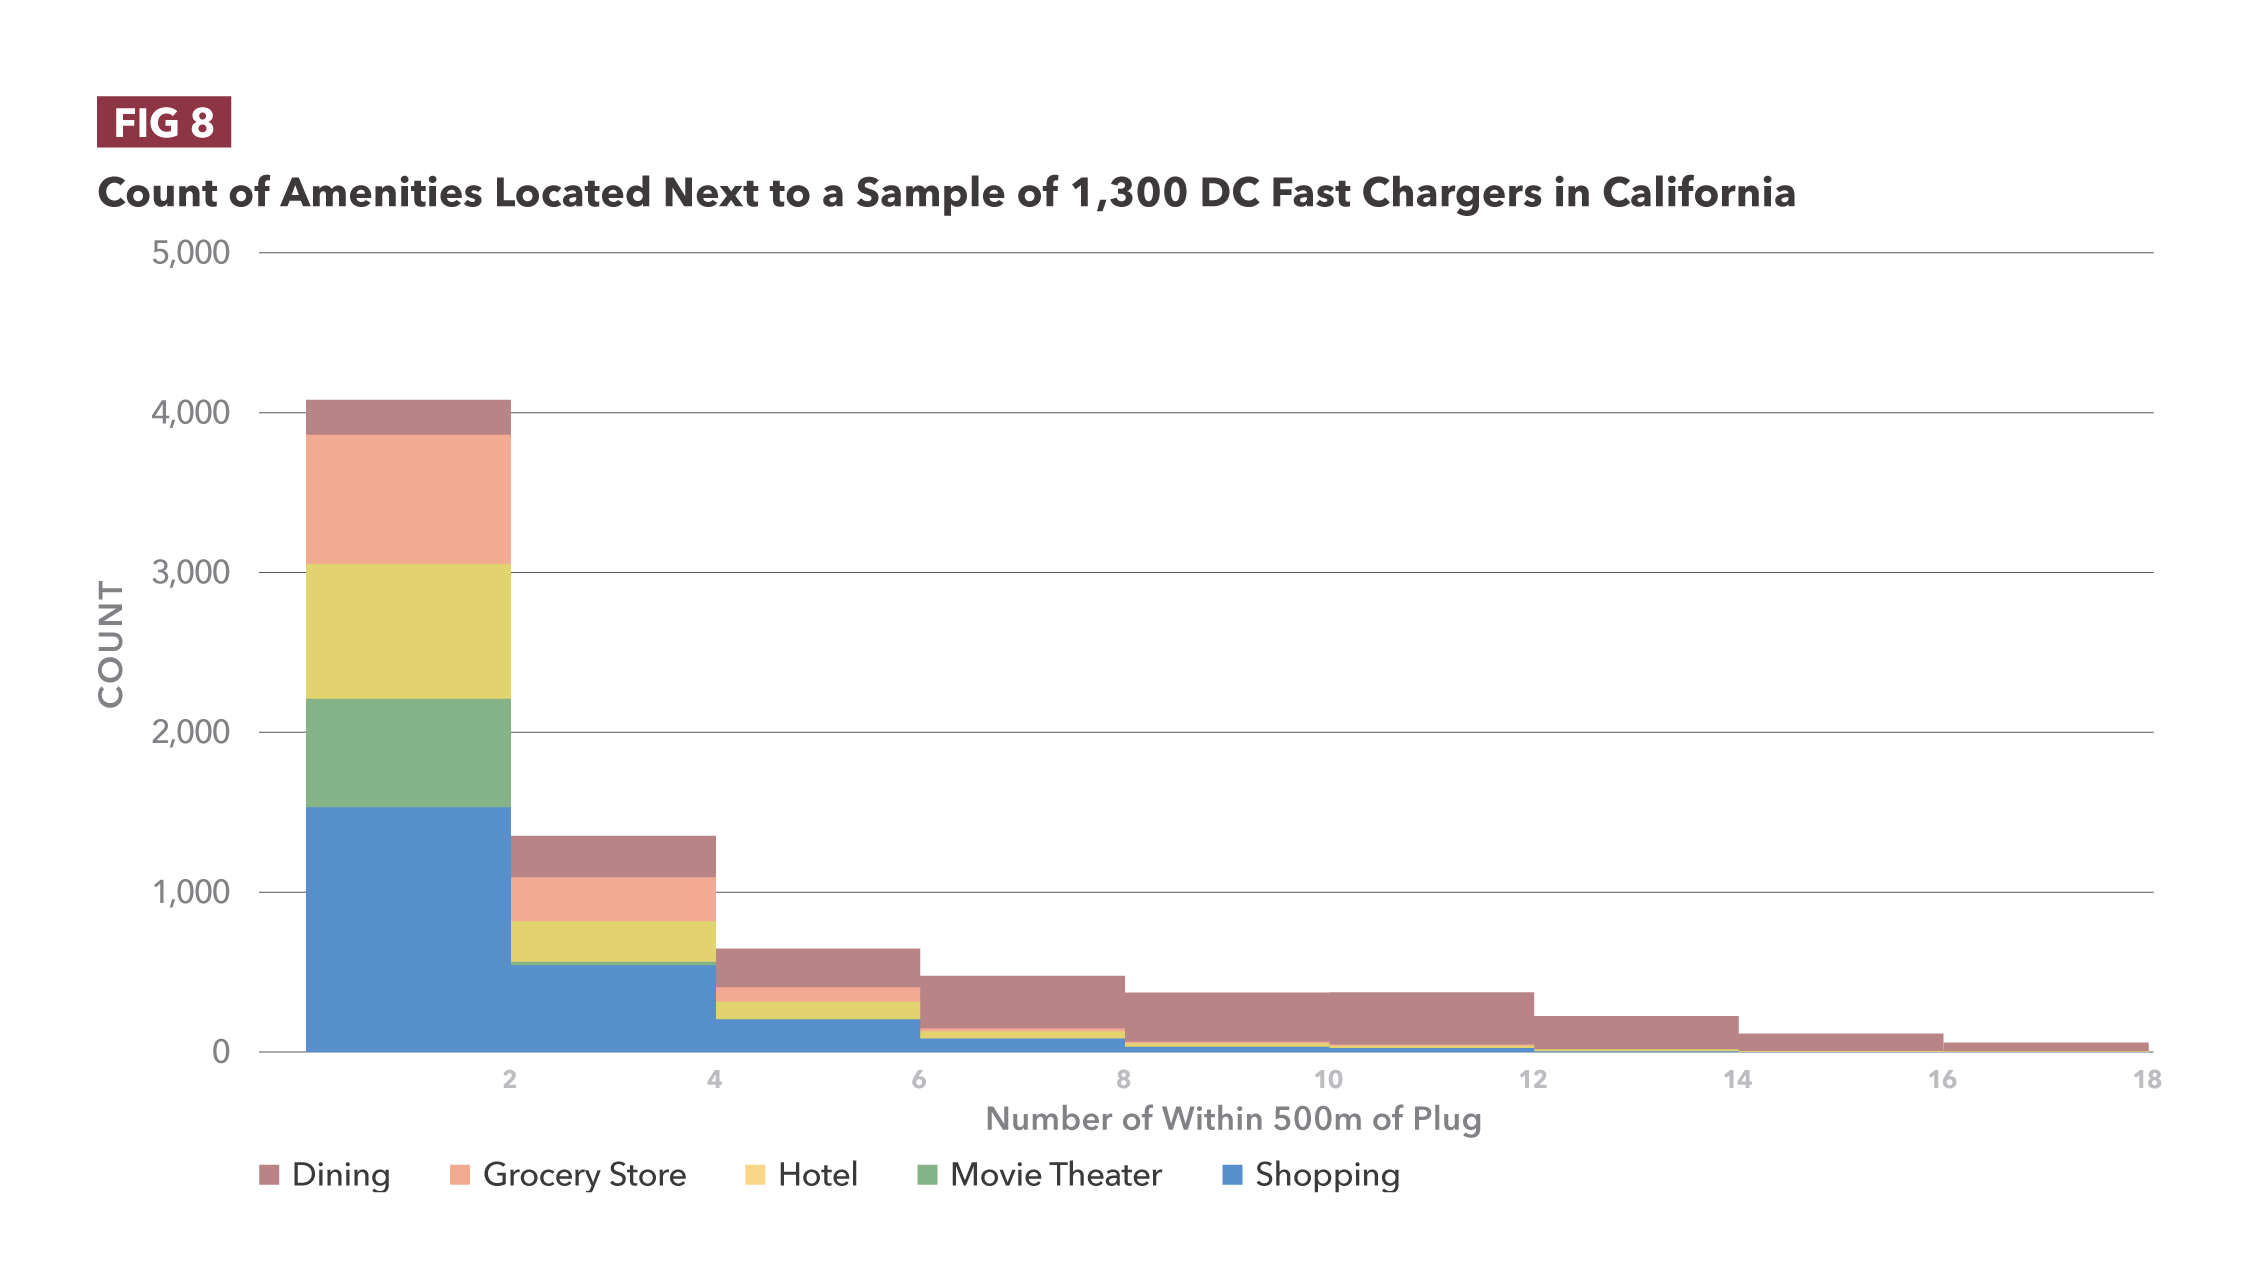
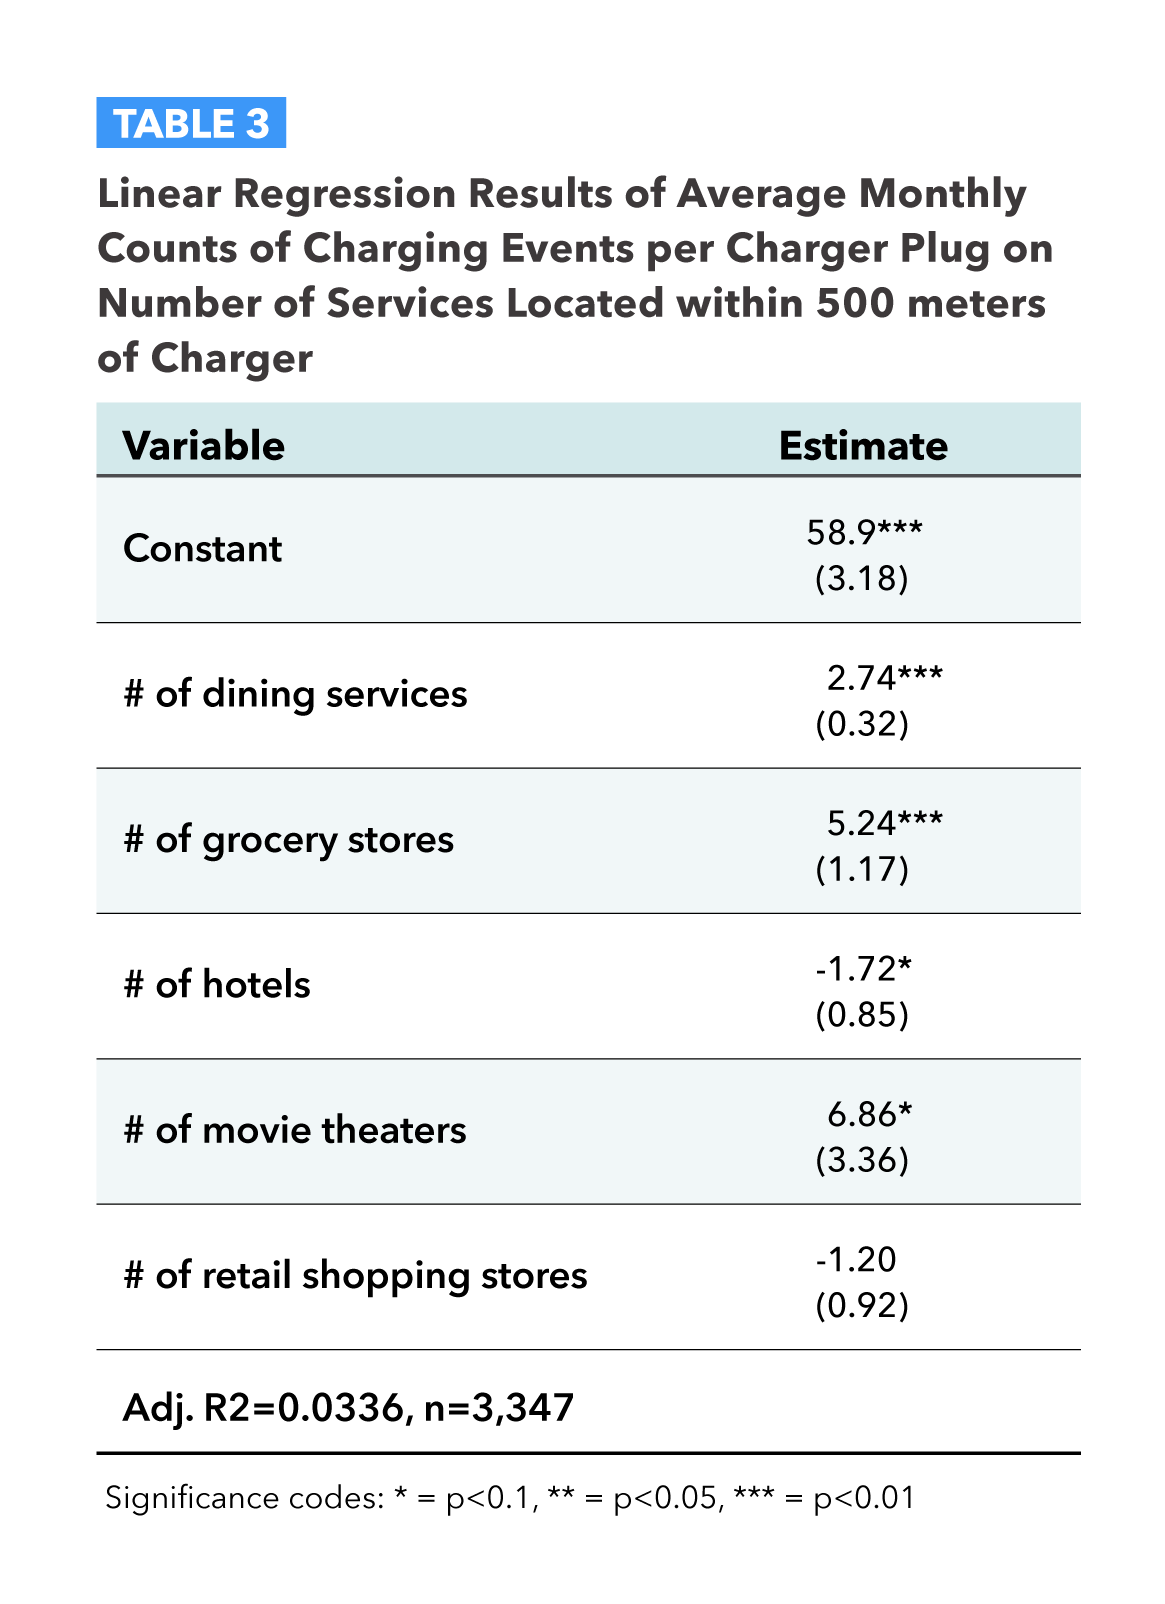
The analysis shows that public chargers are frequented more when located within 500 meters of both dining services (with an average increase of 2.7 times more charging events per month per nearby restaurant) and grocery stores (with an average increase of 5.2 times more charging events per month per nearby grocery store). Chargers could therefore bring more customers to businesses (improving business revenue) or fast chargers could be located with amenities co-owned by charging providers to provide a viable alternative revenue source and help break even on EV charger costs.
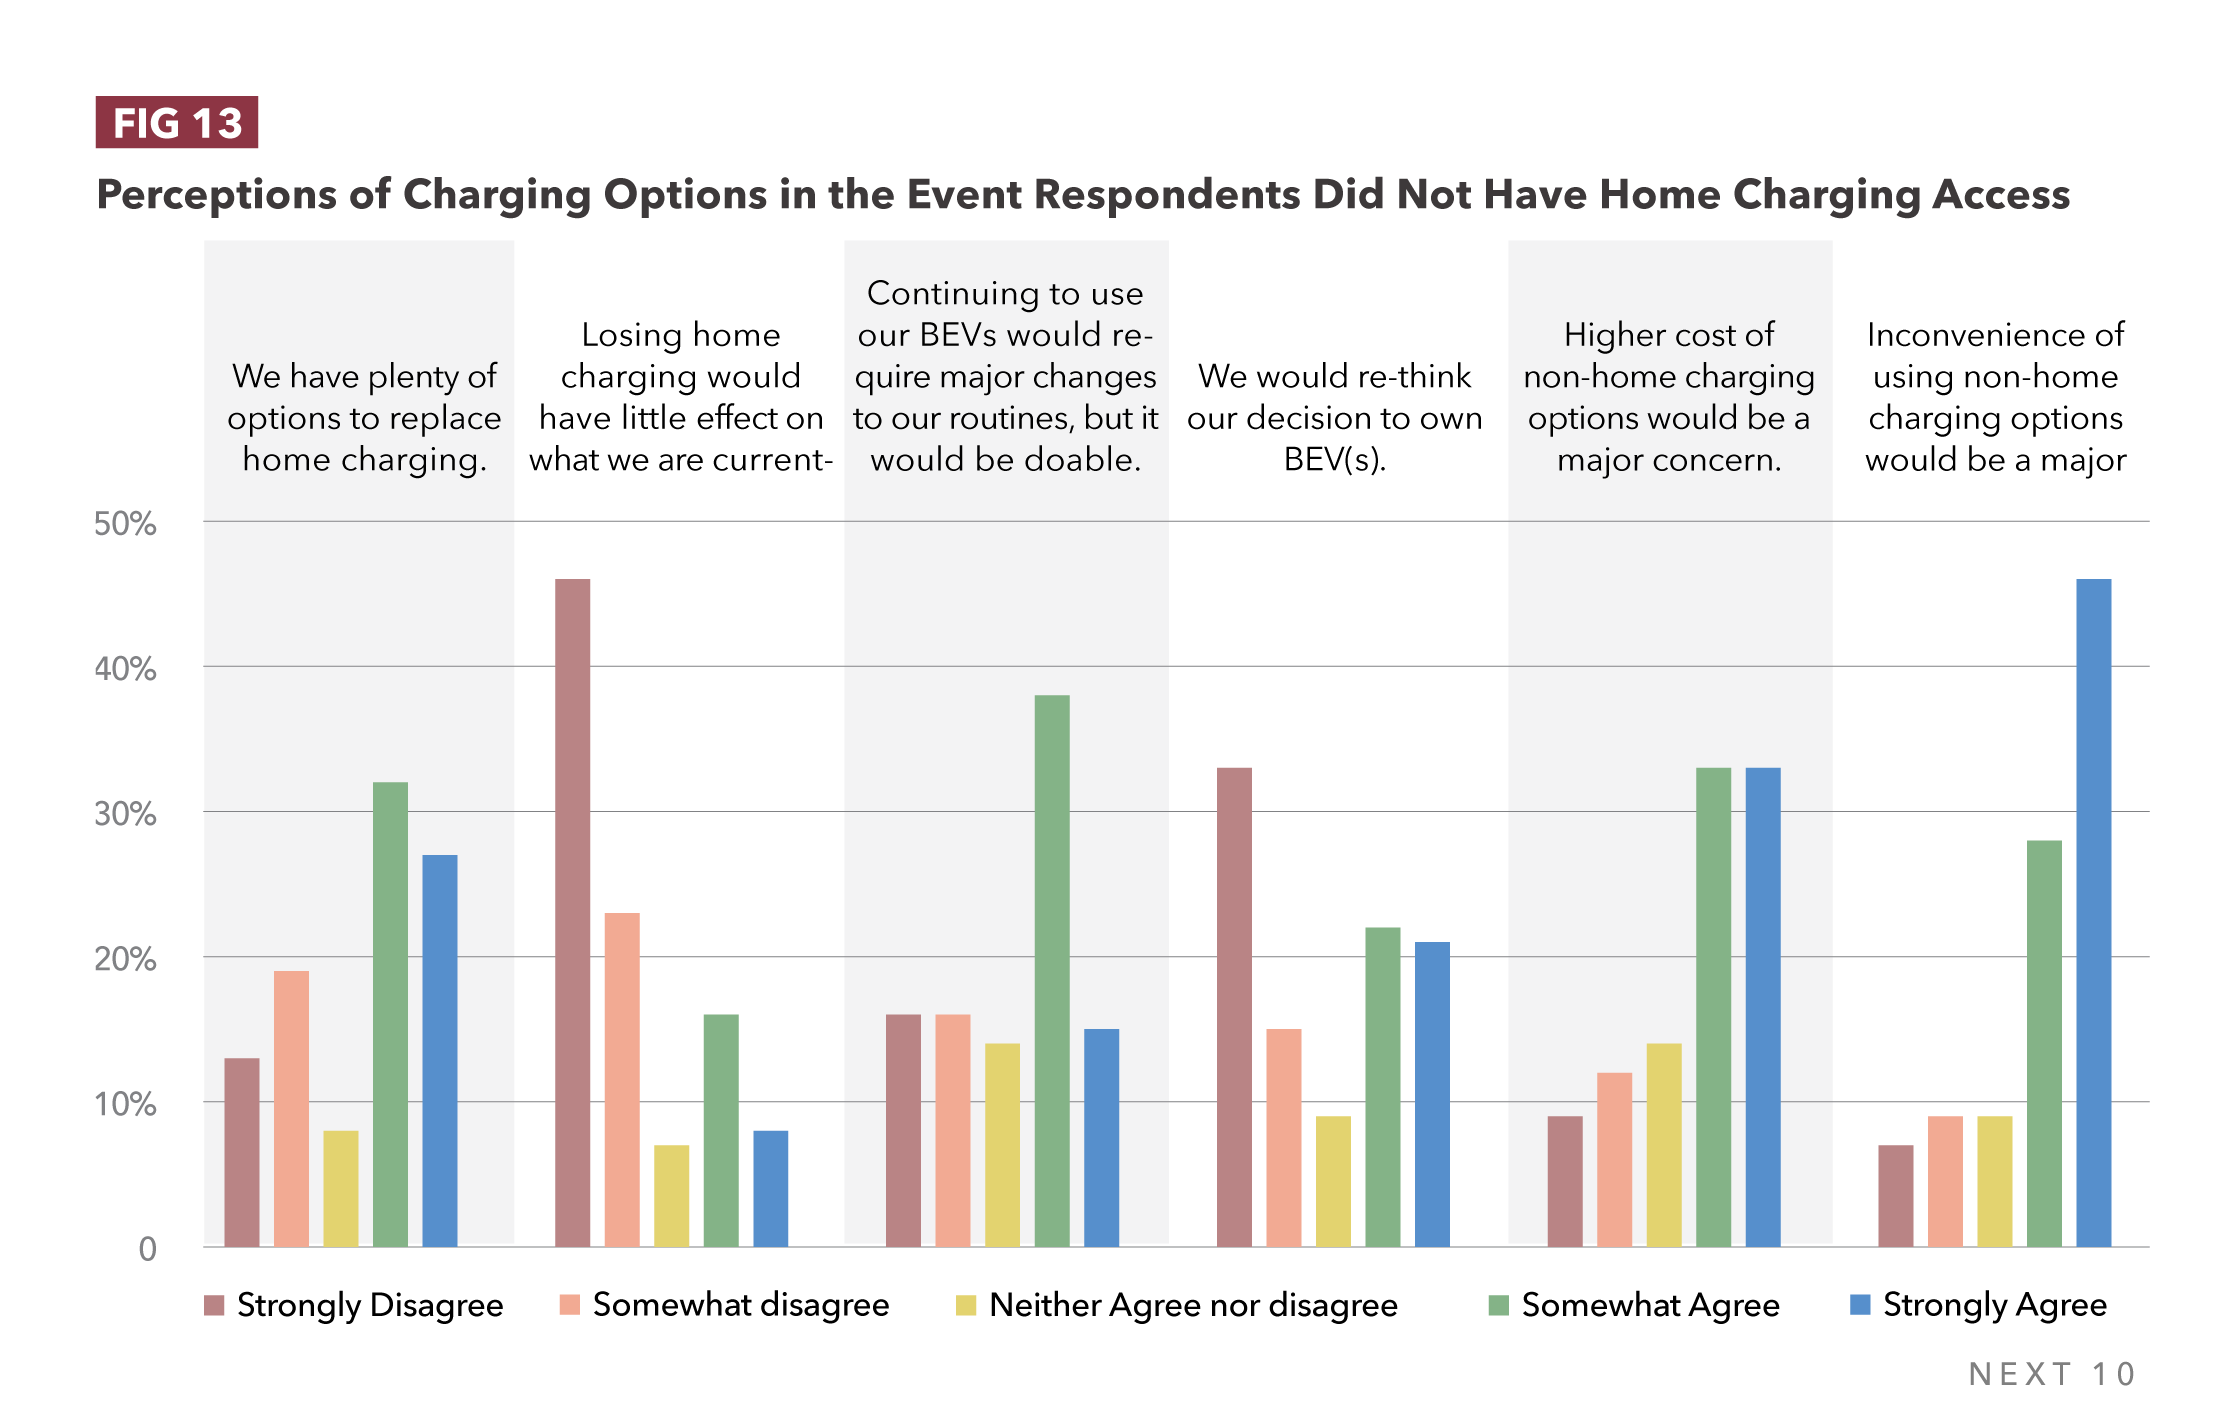
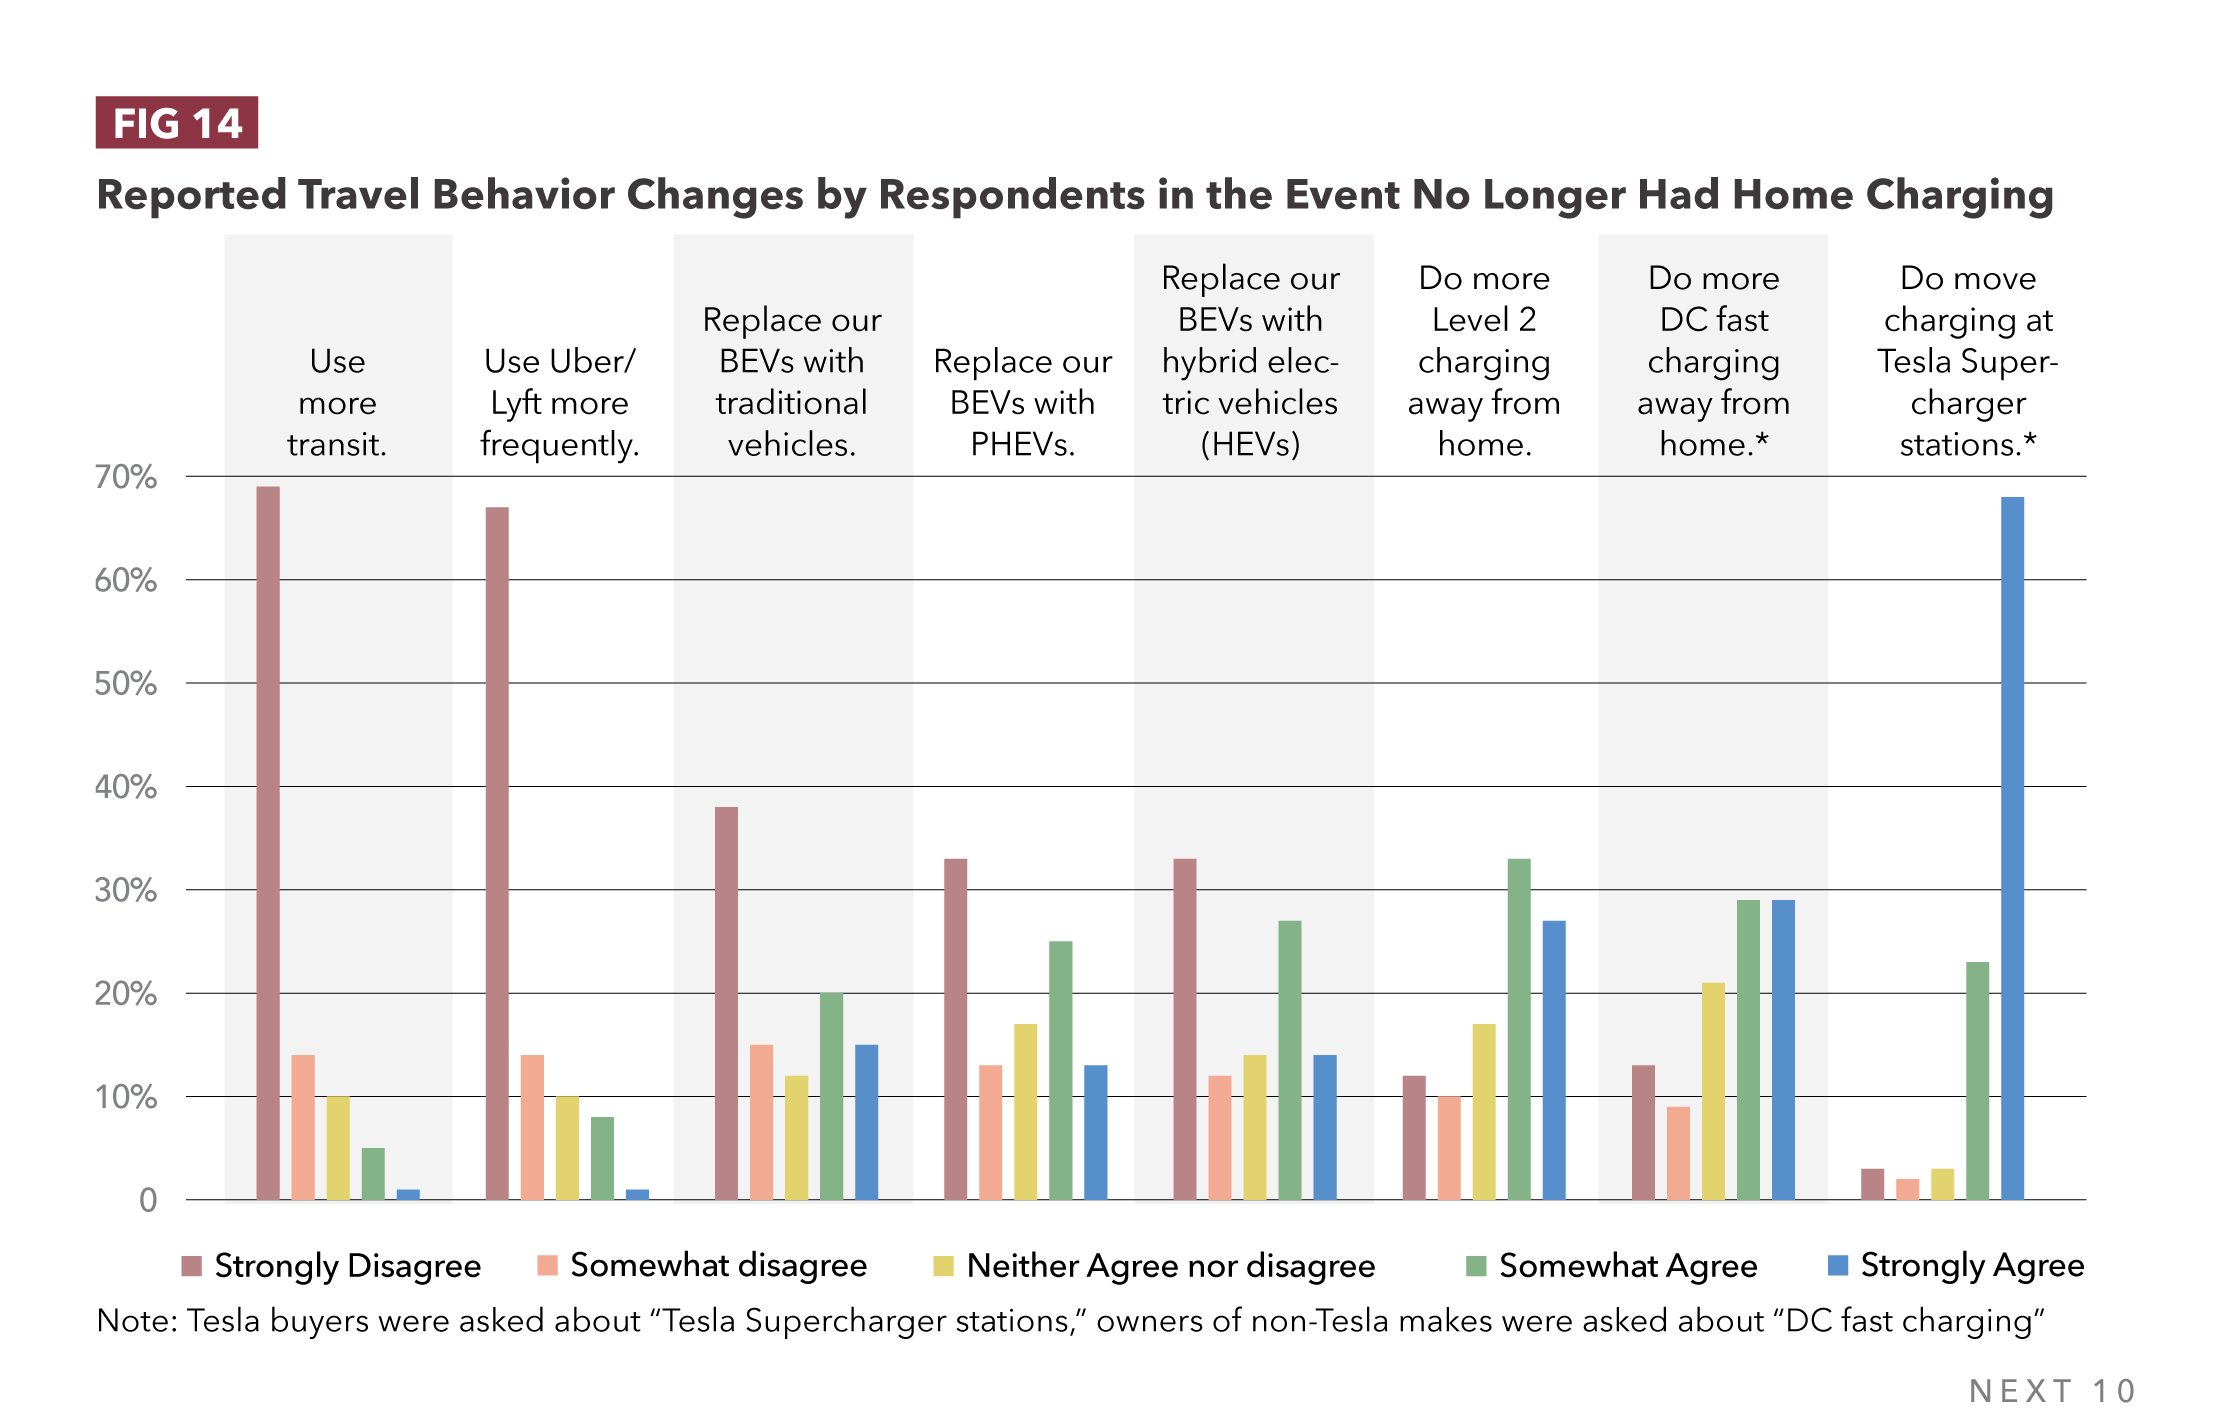
While the demand for public charging is strong, the report survey also reiterates the importance of home charging. The report finds that, without access to home charging, 35% of EV owners would replace their EV with a traditional gas car, while 38% and 41% would replace their EV with a plug-in EV or a hybrid, respectively. 84% of California EV drivers are worried about the lack of charging options outside their homes. This highlights the importance of scaling public EV fast charging in order to support the success of the growing EV market.
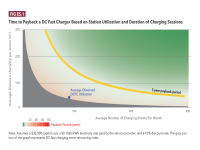
Currently, subsidies are crucial to the deployment of EV charging infrastructure in California and across the country. These subsidies allow operators to recoup their costs faster — regardless of whether services and amenities are co-located to drive additional revenue. Without subsidies, it would take more than 10 years to break-even on charging infrastructure investments based on average use. Other options for reducing the payback period include leveraging symbiotic business relationships between convenience stores or restaurants and EV chargers, changes in the charging model, increases in electricity prices, or reductions in charging installation costs beyond subsidies.
Overall, the report recommends that California continue to support charging access at home and in the community while balancing subsidies with strategies for improving the profitability of charging stations. Key recommendations of the report include:
- Increase the availability of public chargers at places where Californians do or want to visit, while upping the efficiency with DC fast chargers.
- Increase public support for home charger installation while using consumer preferences as a guide post.
- Balance public subsidies with strategies for encouraging the profitability of EV charging stations independent of outside intervention.
Next 10 is not the sole owner of rights to this publication. Usage of this content is subject to permissions, please contact us at info@next10.org for more information.
Featured Graphics

Part 1 — The Business Case for Public Electric Vehicle Chargers
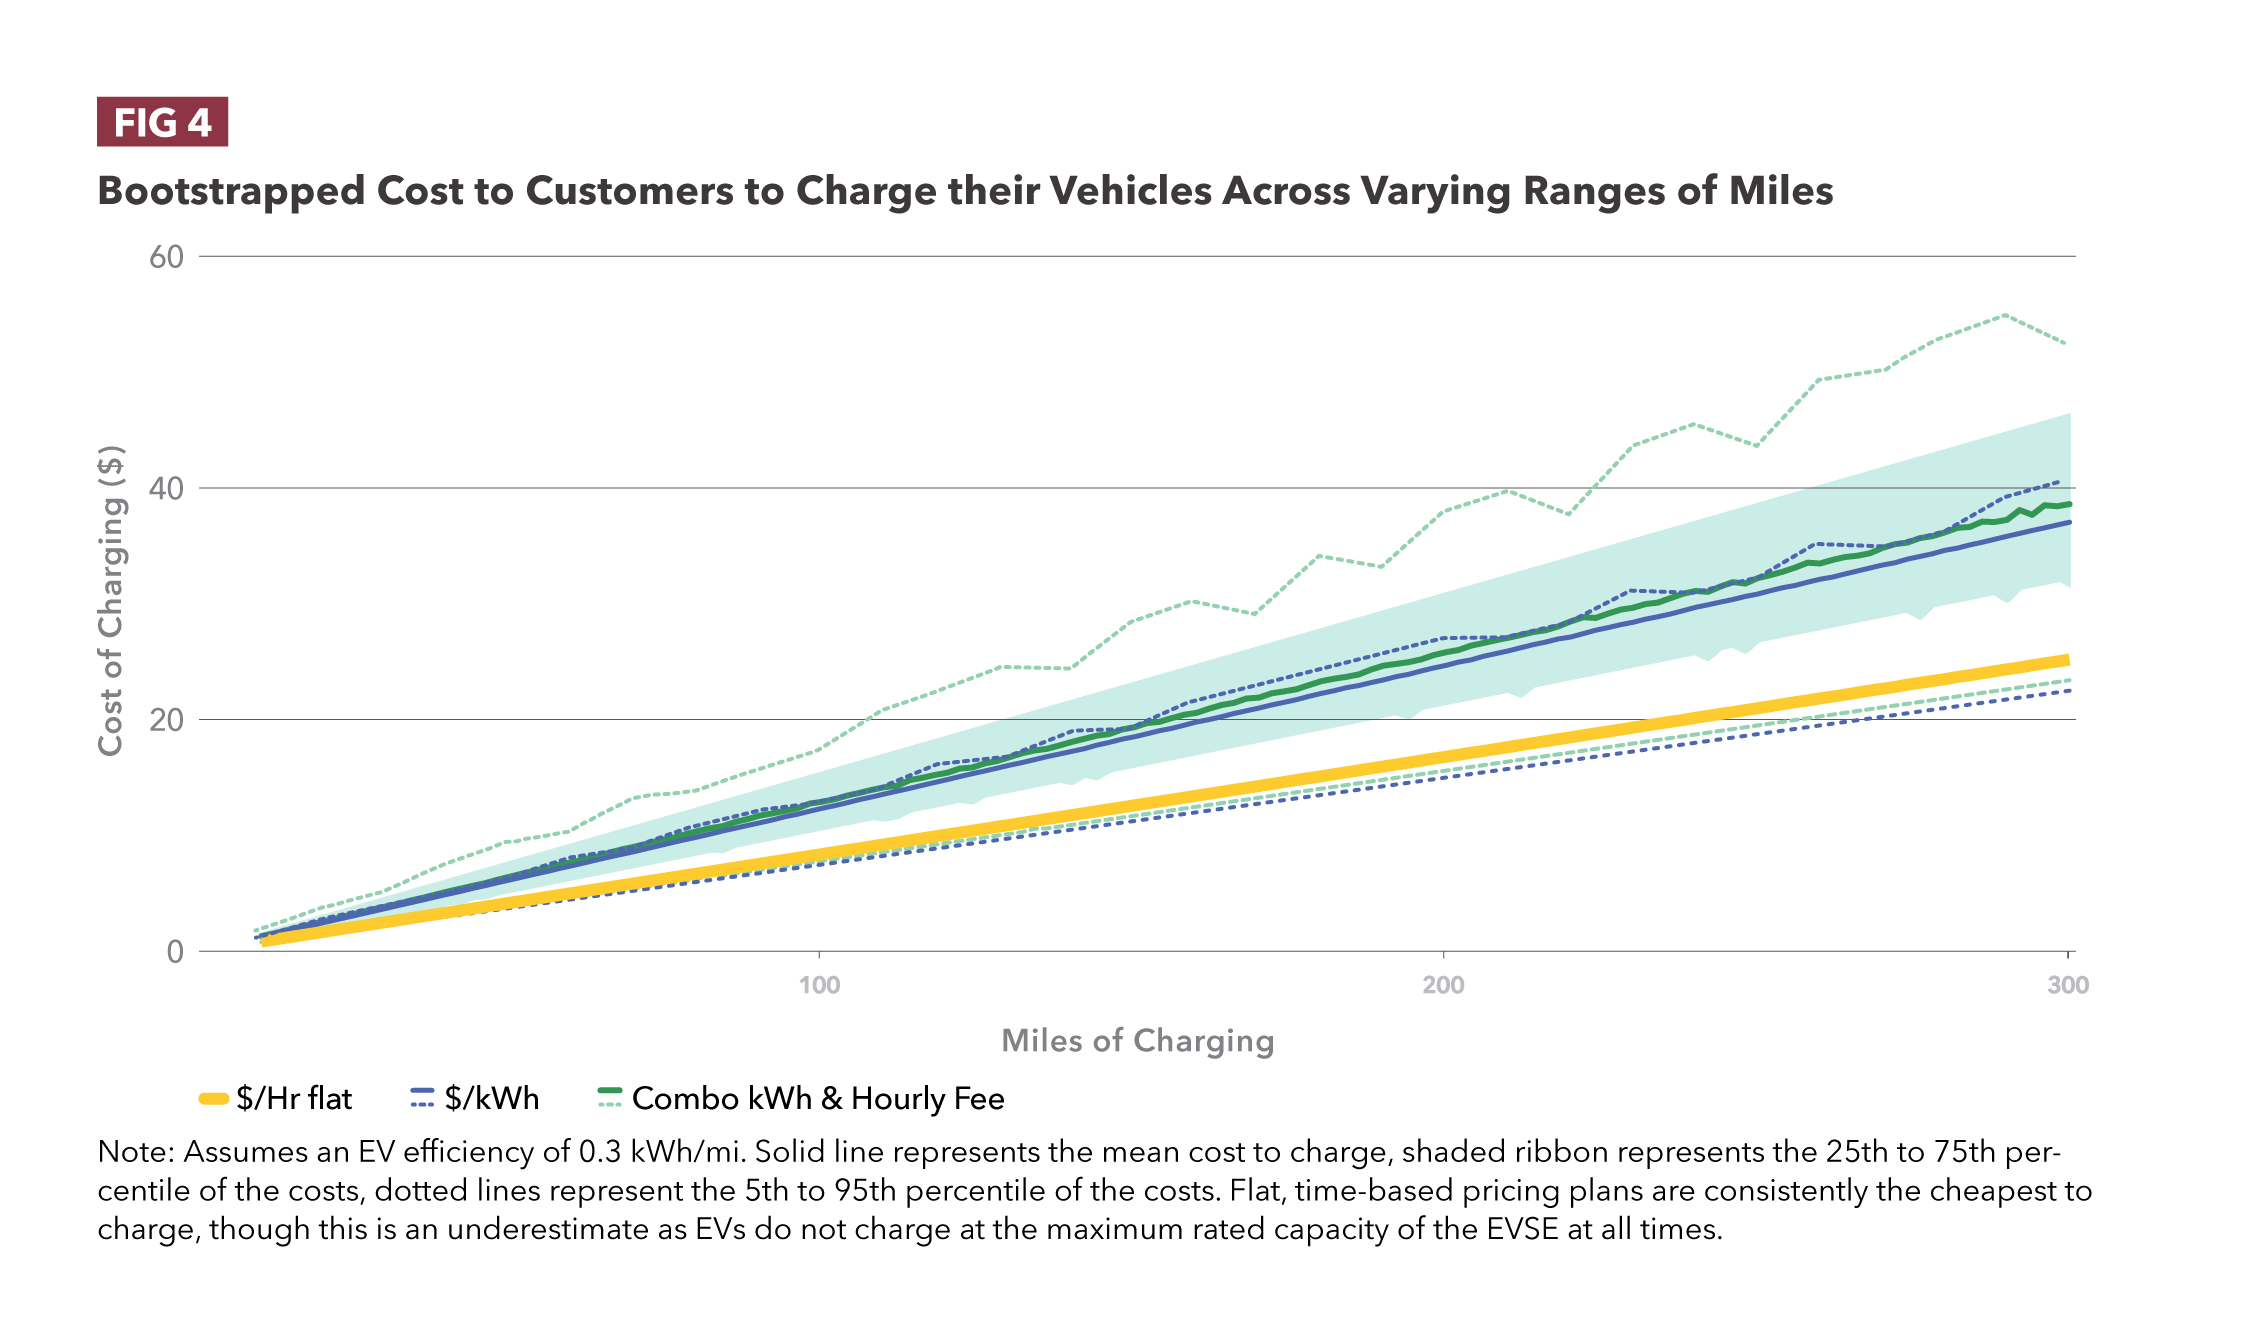
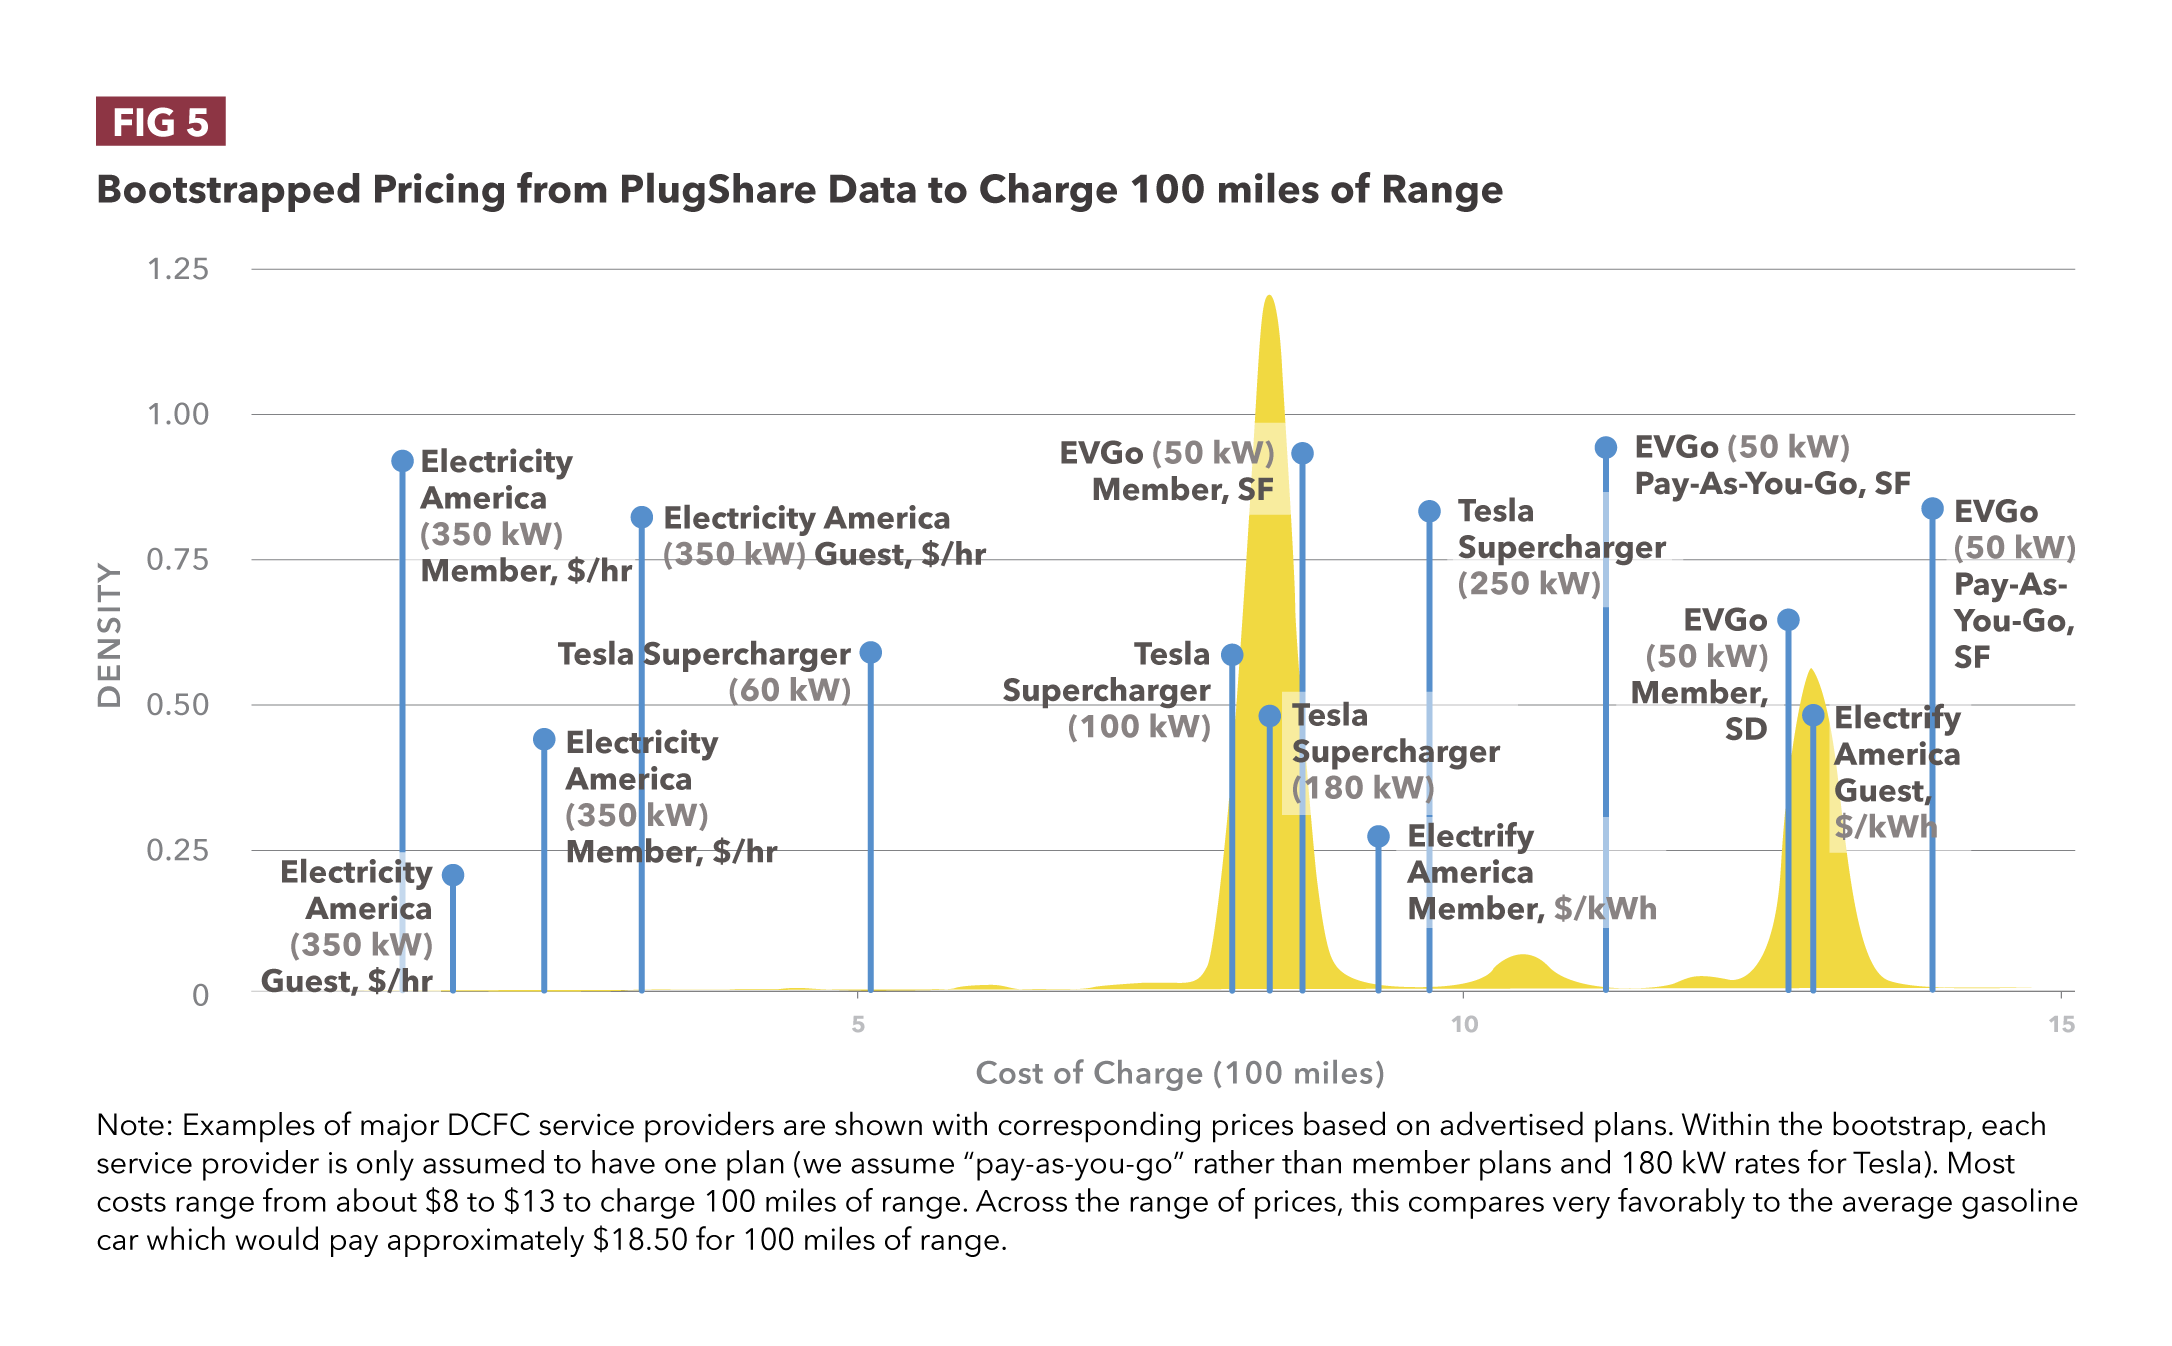
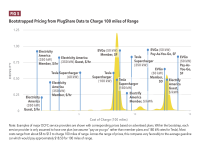
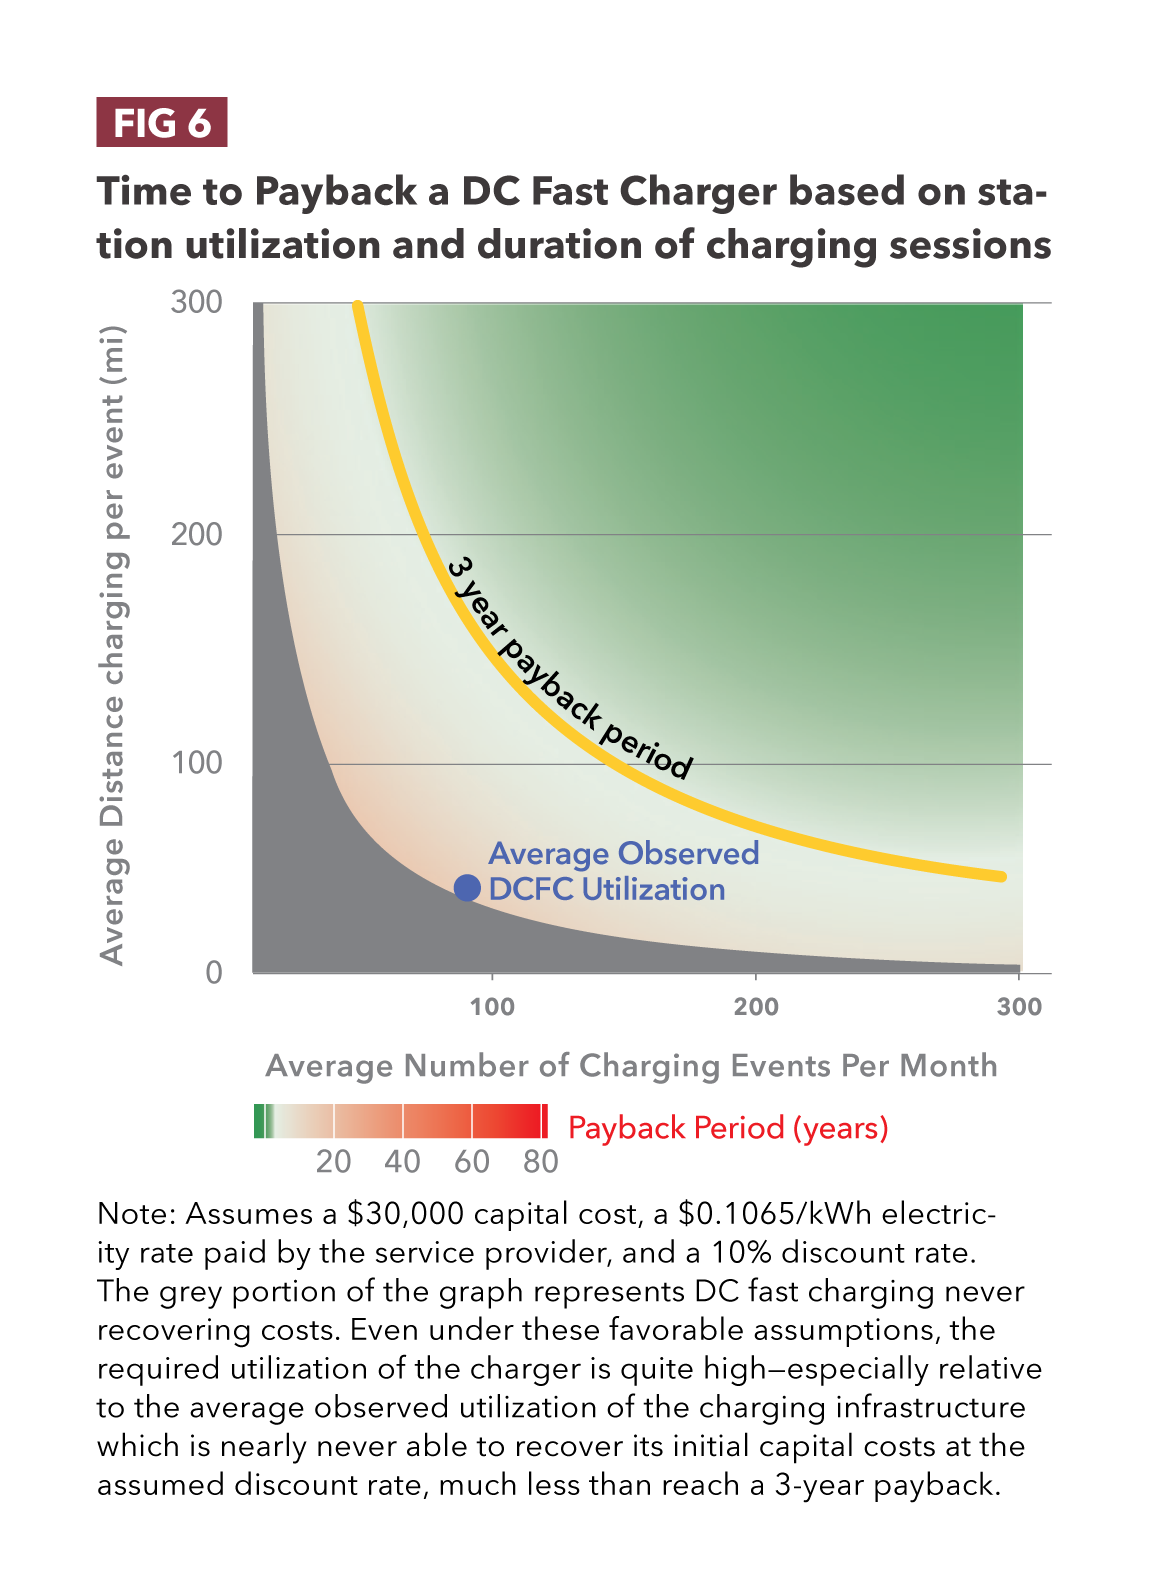
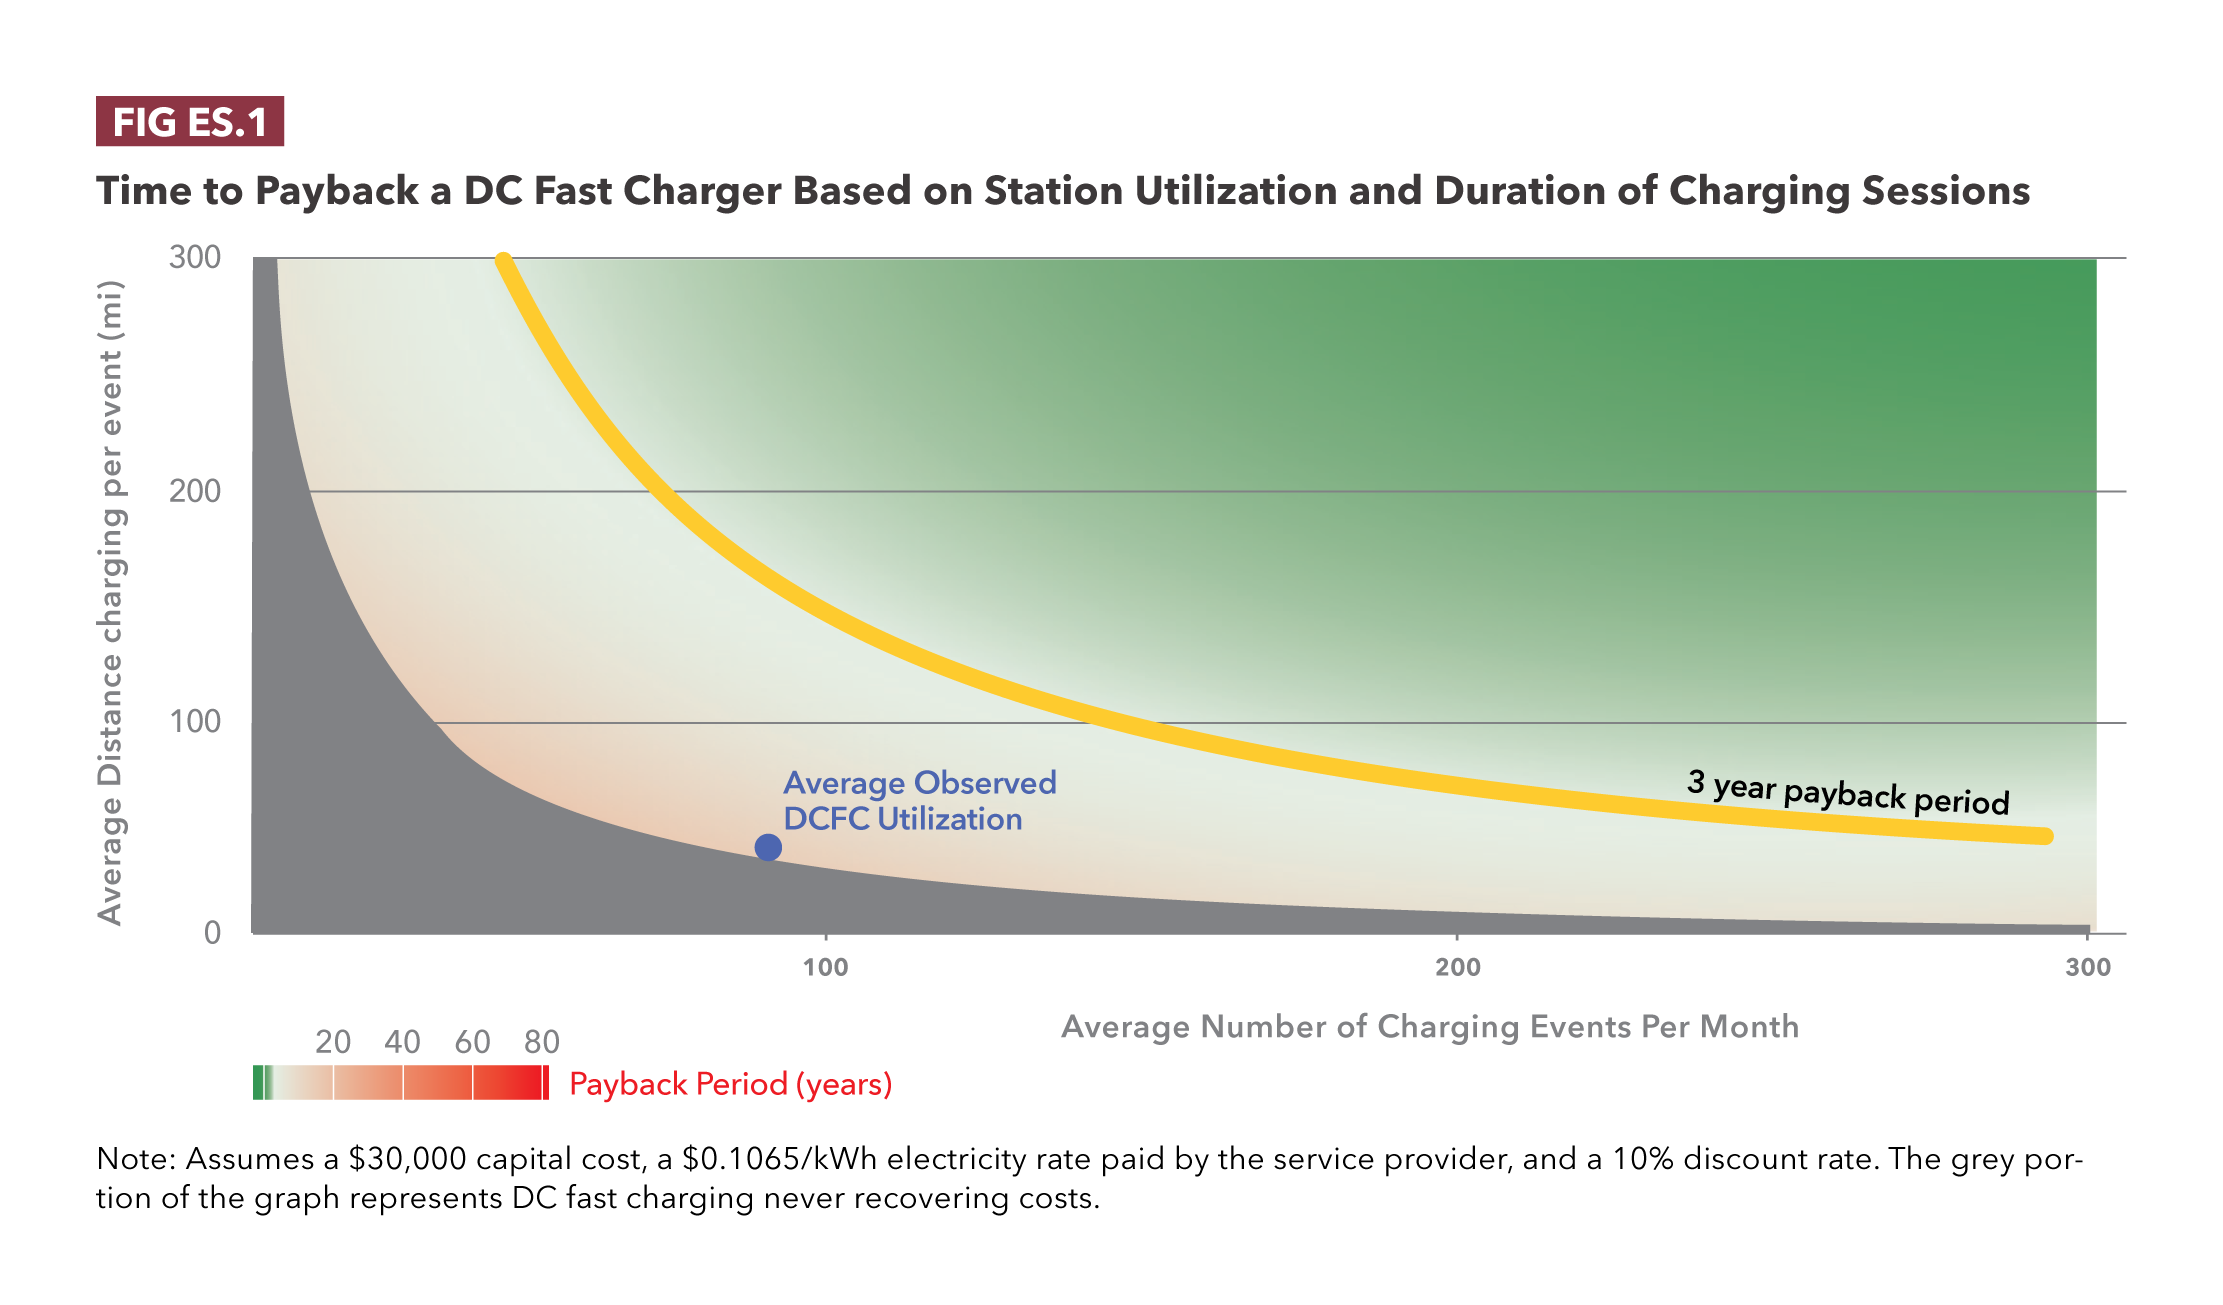
- No existing public EV charger can break even within three years (i.e., they are unable to recover its initial capital costs). Based on the average observed utilization, it would take more than 10 years to break even.
- Even if both the number of charging events and the average amount of energy dispensed were to double, charging infrastructure would still barely be unable to meet a 3-year payback.
- In the absence of government subsidies, fast chargers would likely be an unsustainable business without a change in charging behavior and/or a drastic increase in electricity prices seen by consumers, or substantial reductions in charging installation costs.
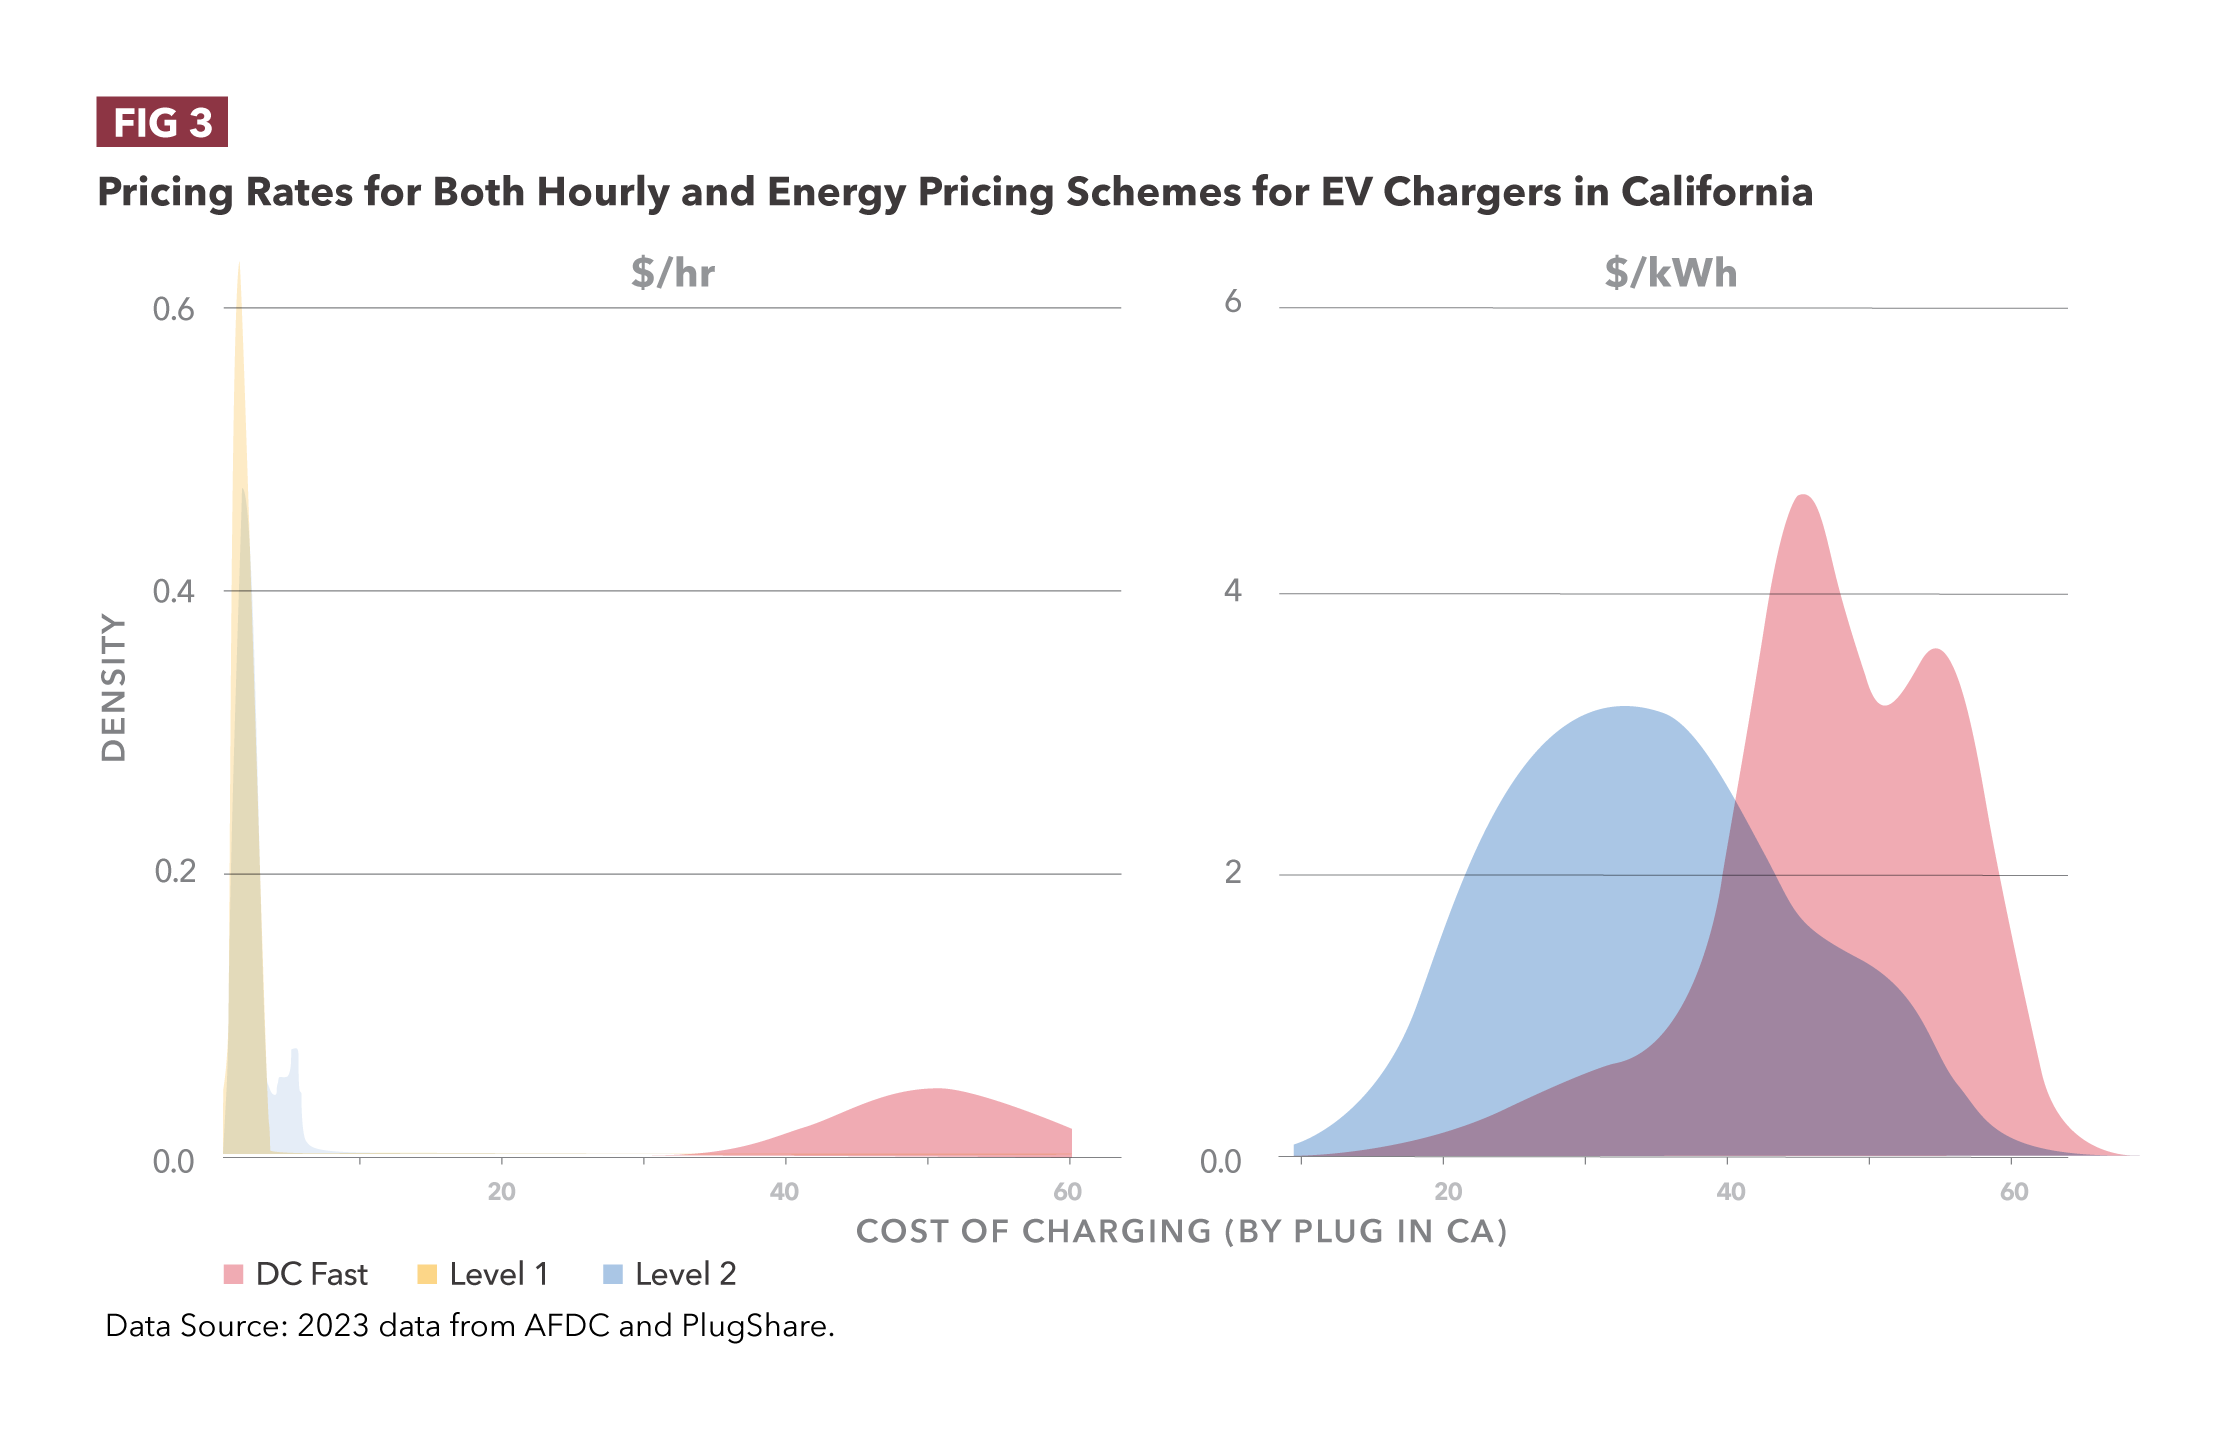
- This analysis shows public chargers experience more utilization when they are located within 500 meters of both dining services (with an average increase of 2.7 charging events per month per nearby restaurant) and grocery stores (with an average increase of 5.2 charging events per month per nearby grocery store).
Part 2 — Consumer Evaluations of Charging Infrastructure and Preferences for Fast Charging Infrastructure
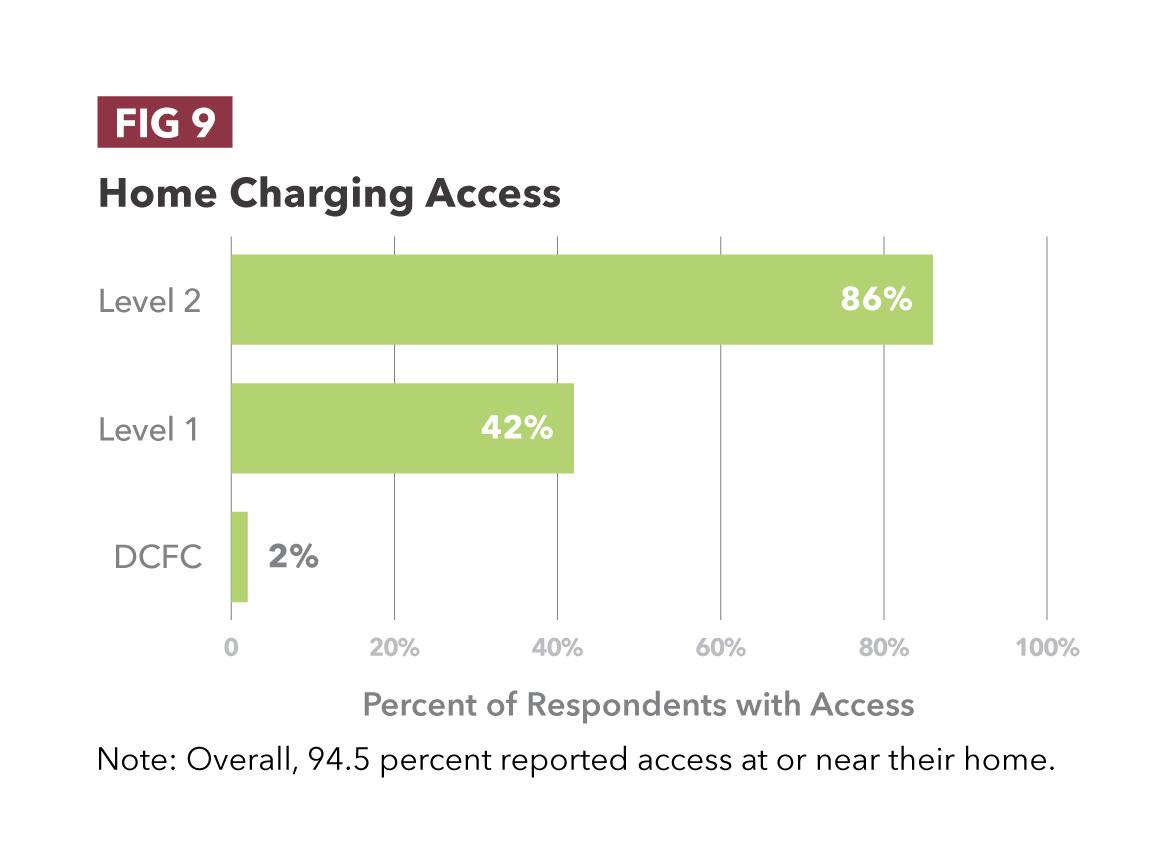
- 94.5 percent of survey respondents have access to charging from home, with 86 percent of respondents reporting access to Level 2 charging, 42 percent with Level 1 charging, and 2 percent reported access to DC fast charging at home.
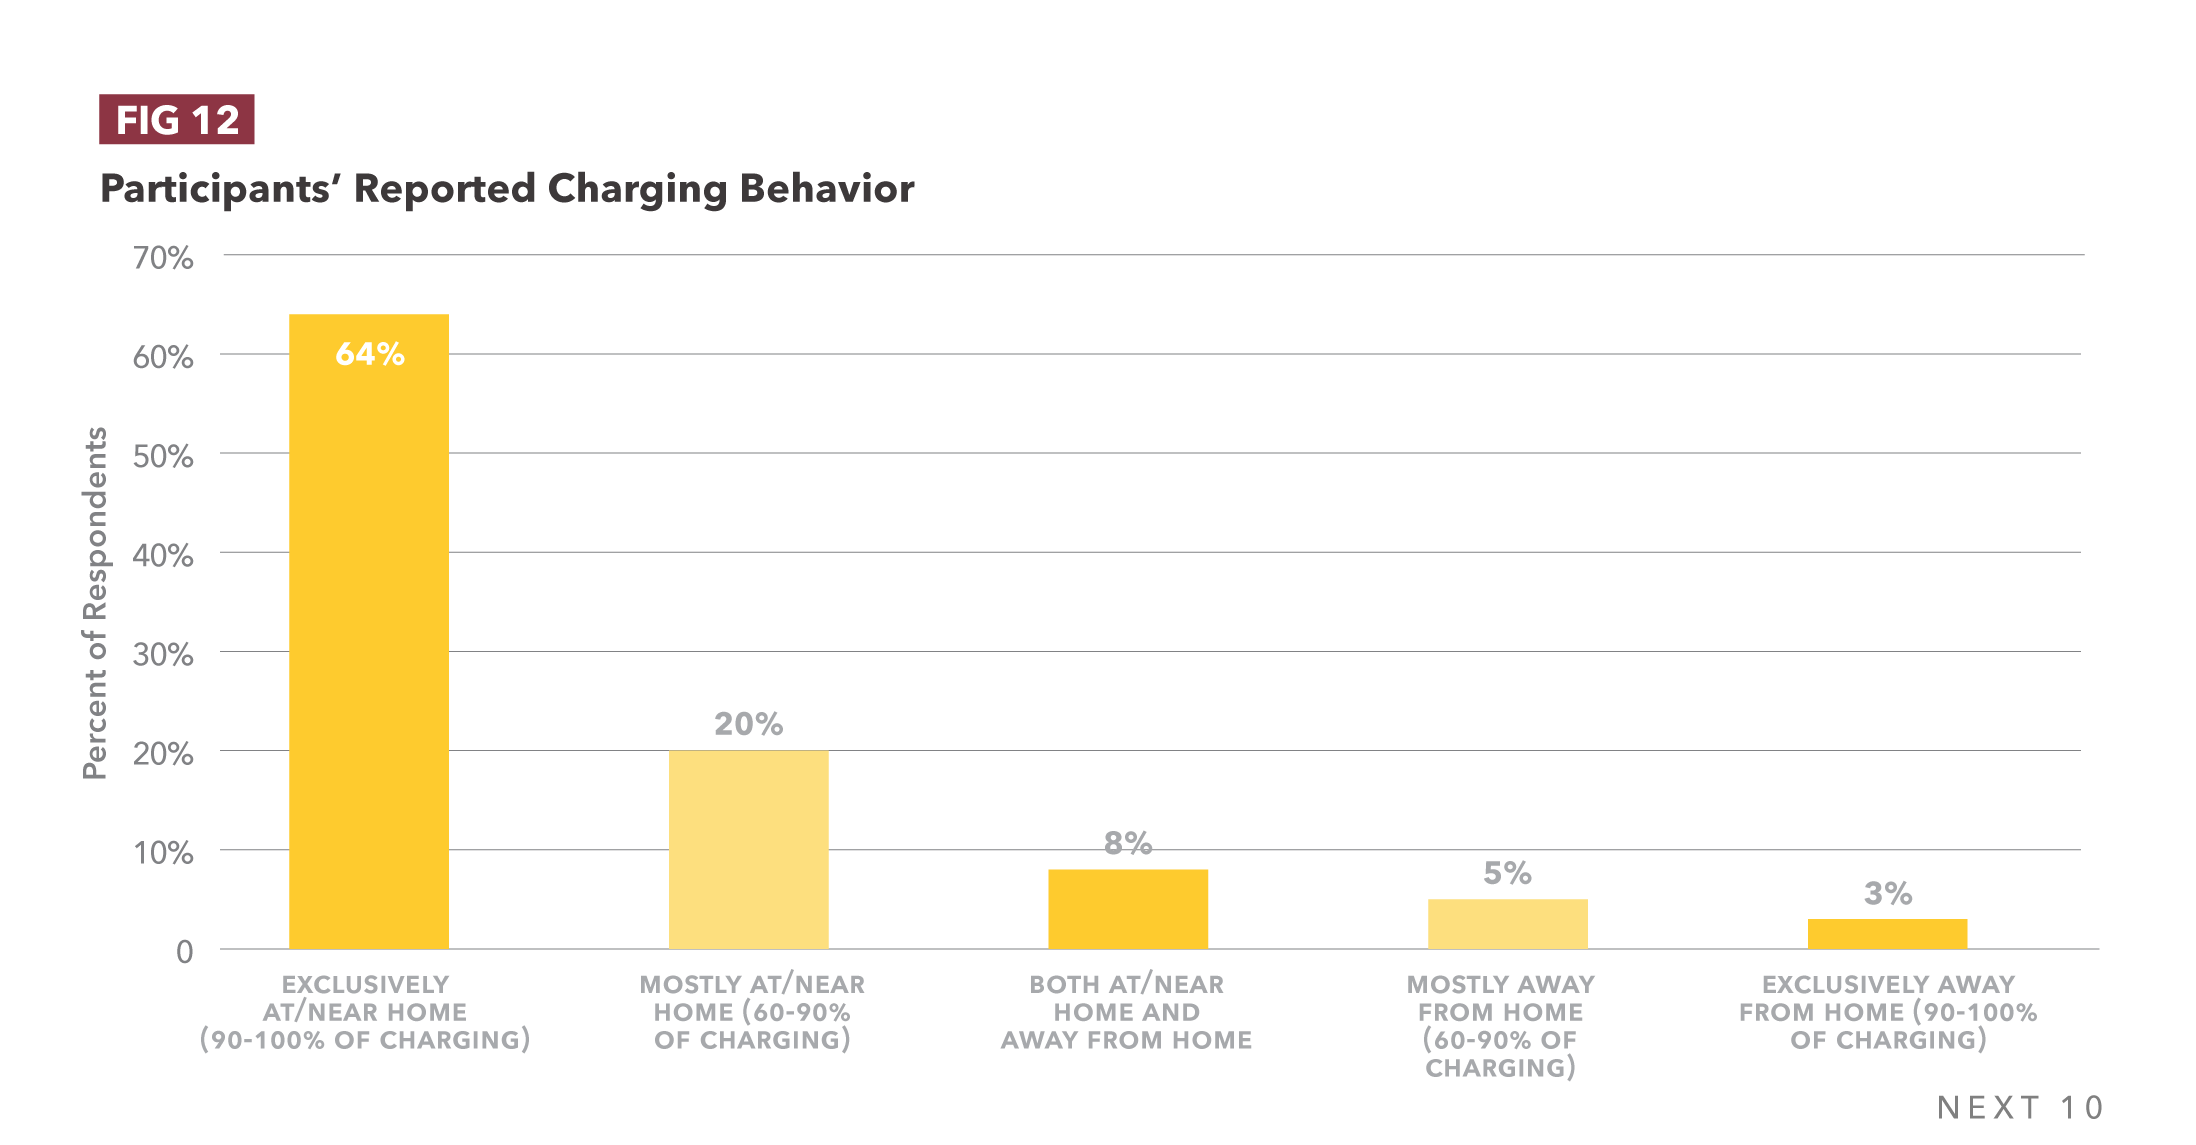
- Most charging occurs at home (2/3 of respondents charge at home 90 percent of the time or more).
- In the absence of home charging, 35% of EV owners would replace their EV with a traditional gas car, while 38% and 41% would replace their EV with a plug-in EV or a hybrid, respectively.
- A large proportion (66%) of BEV owners are also concerned with the high cost of non-home charging, and 84 percent are concerned about the inconvenience of non-home charging options.
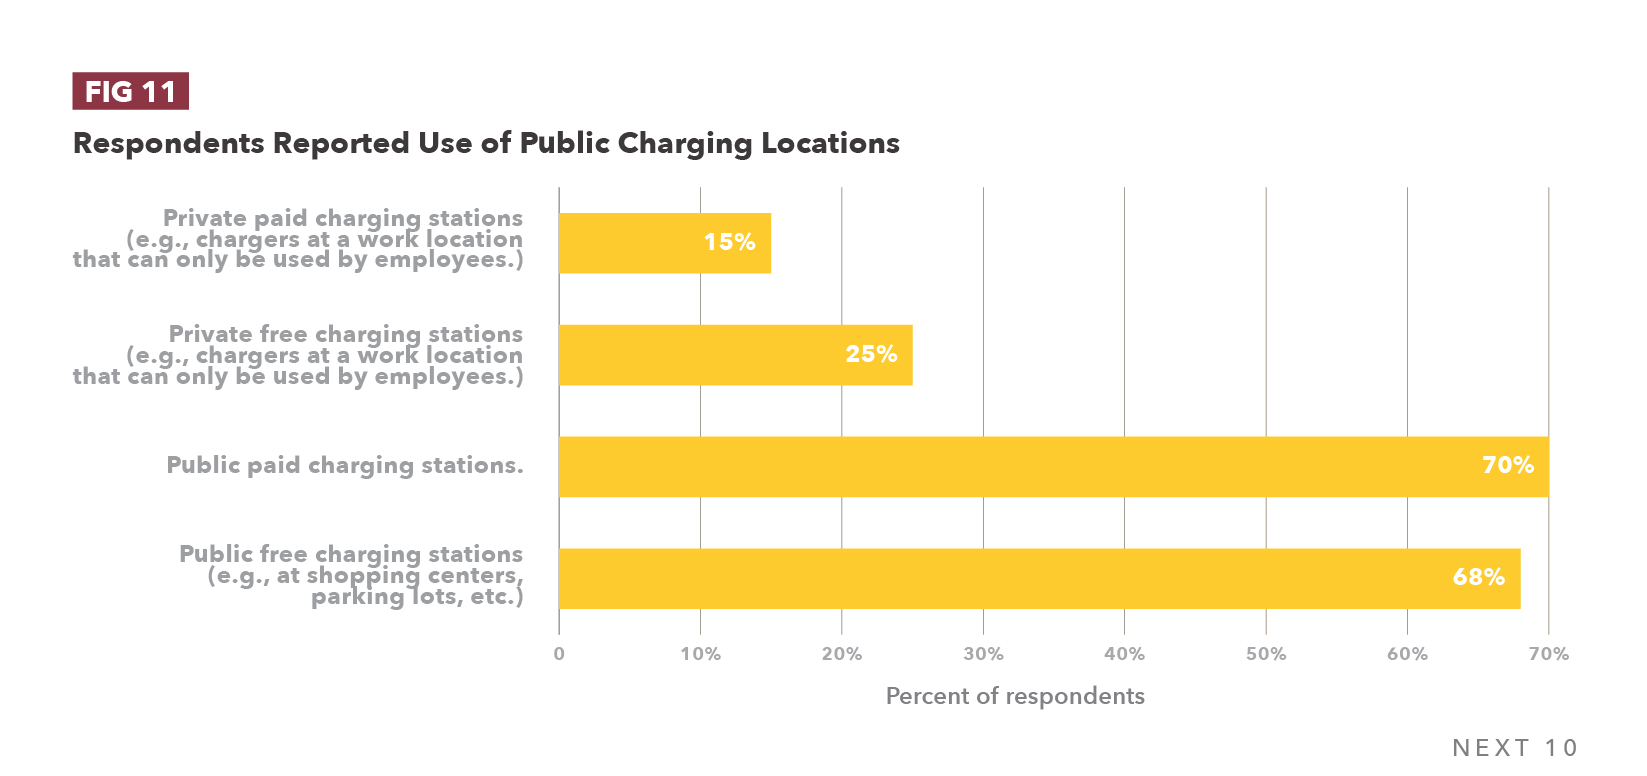
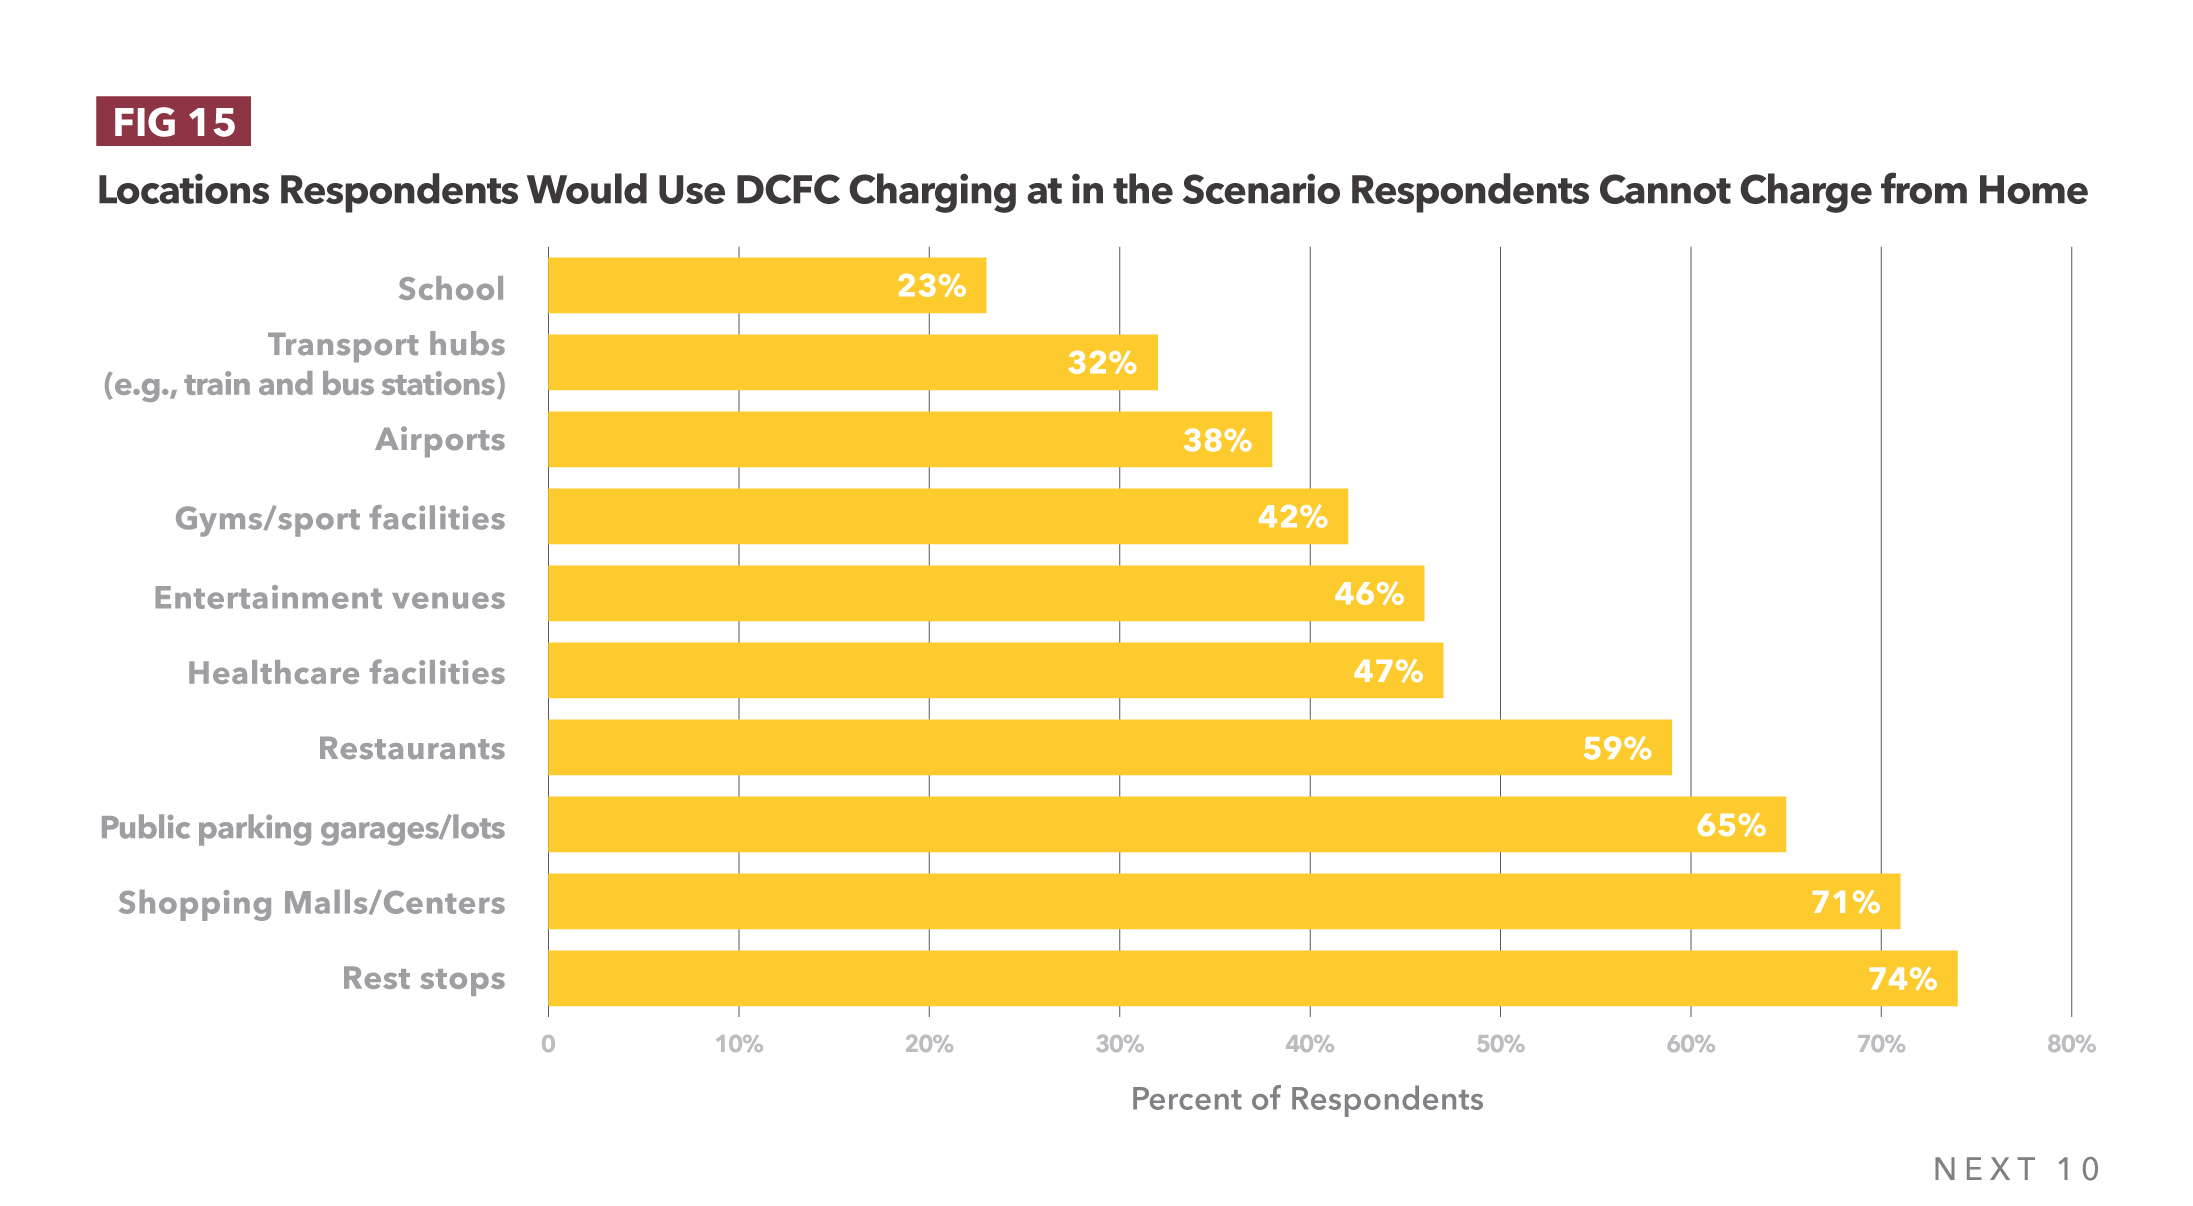
- After rest stops (74%), charging at malls (71%), parking garages (65%), and restaurants (59%) were the most commonly selected preference for non-home charging locations, indicating that drivers prefer charging at destinations they frequently travel to or have opportunities to do other activities while they charge.
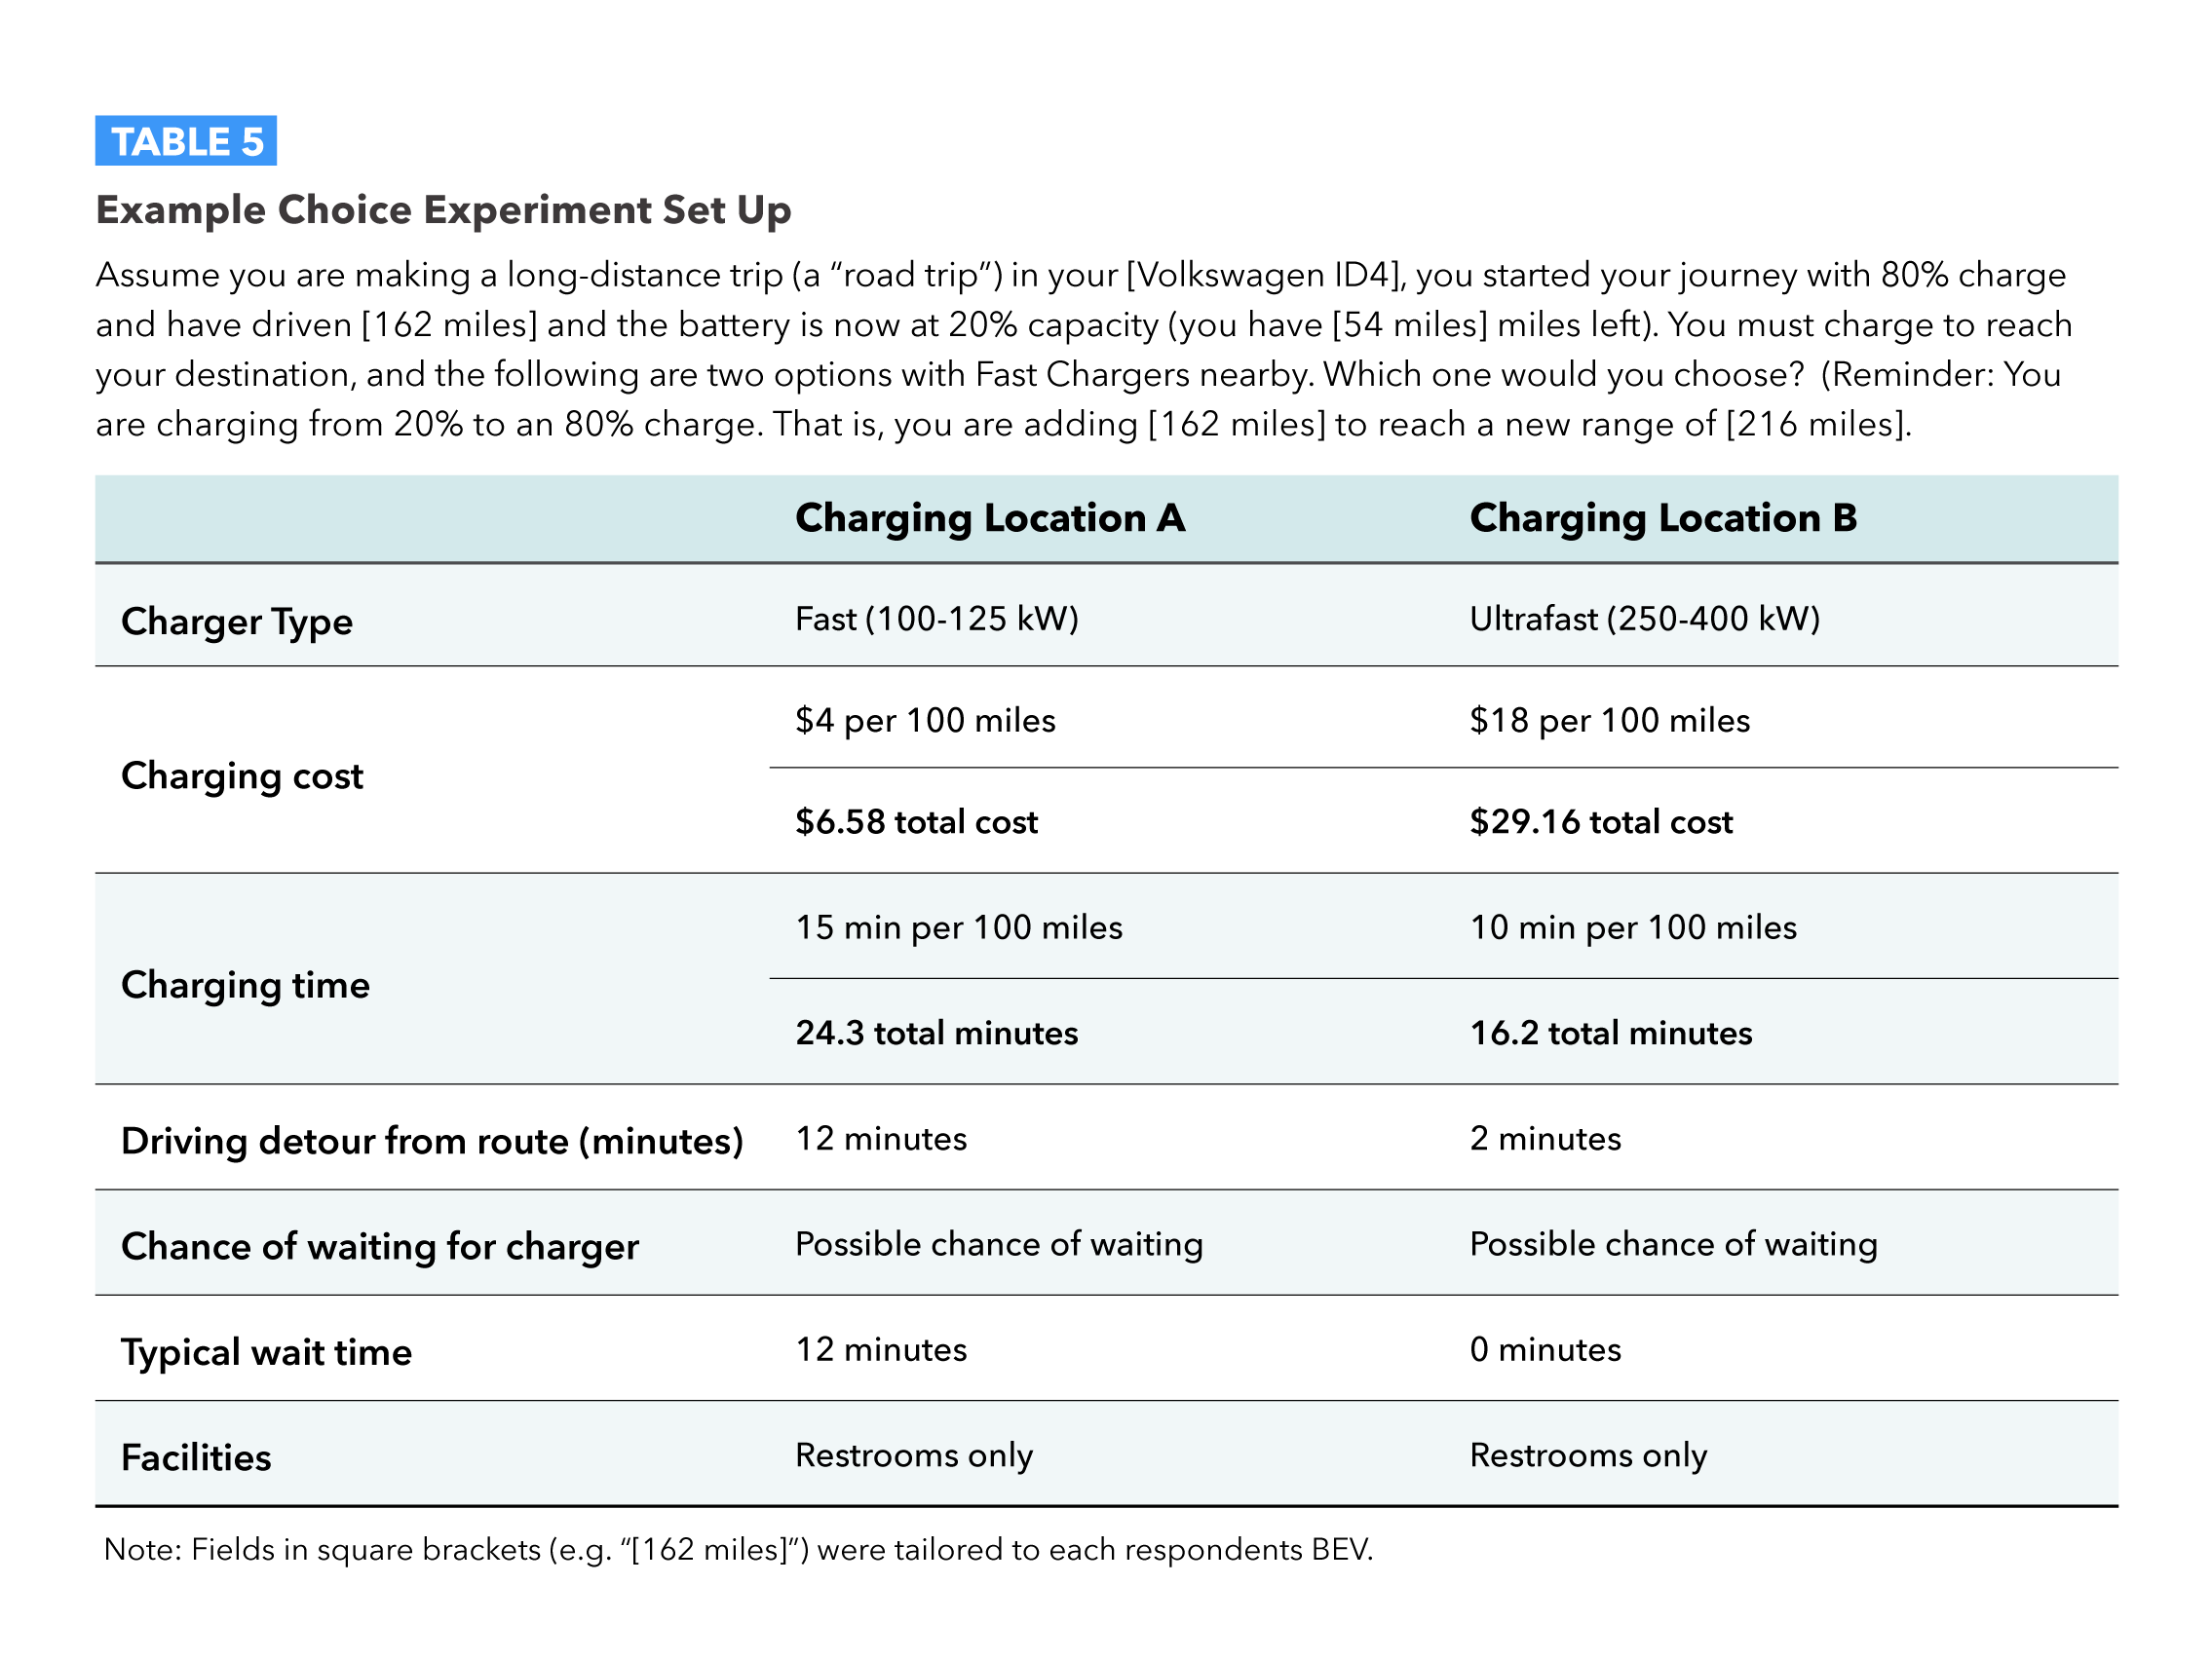
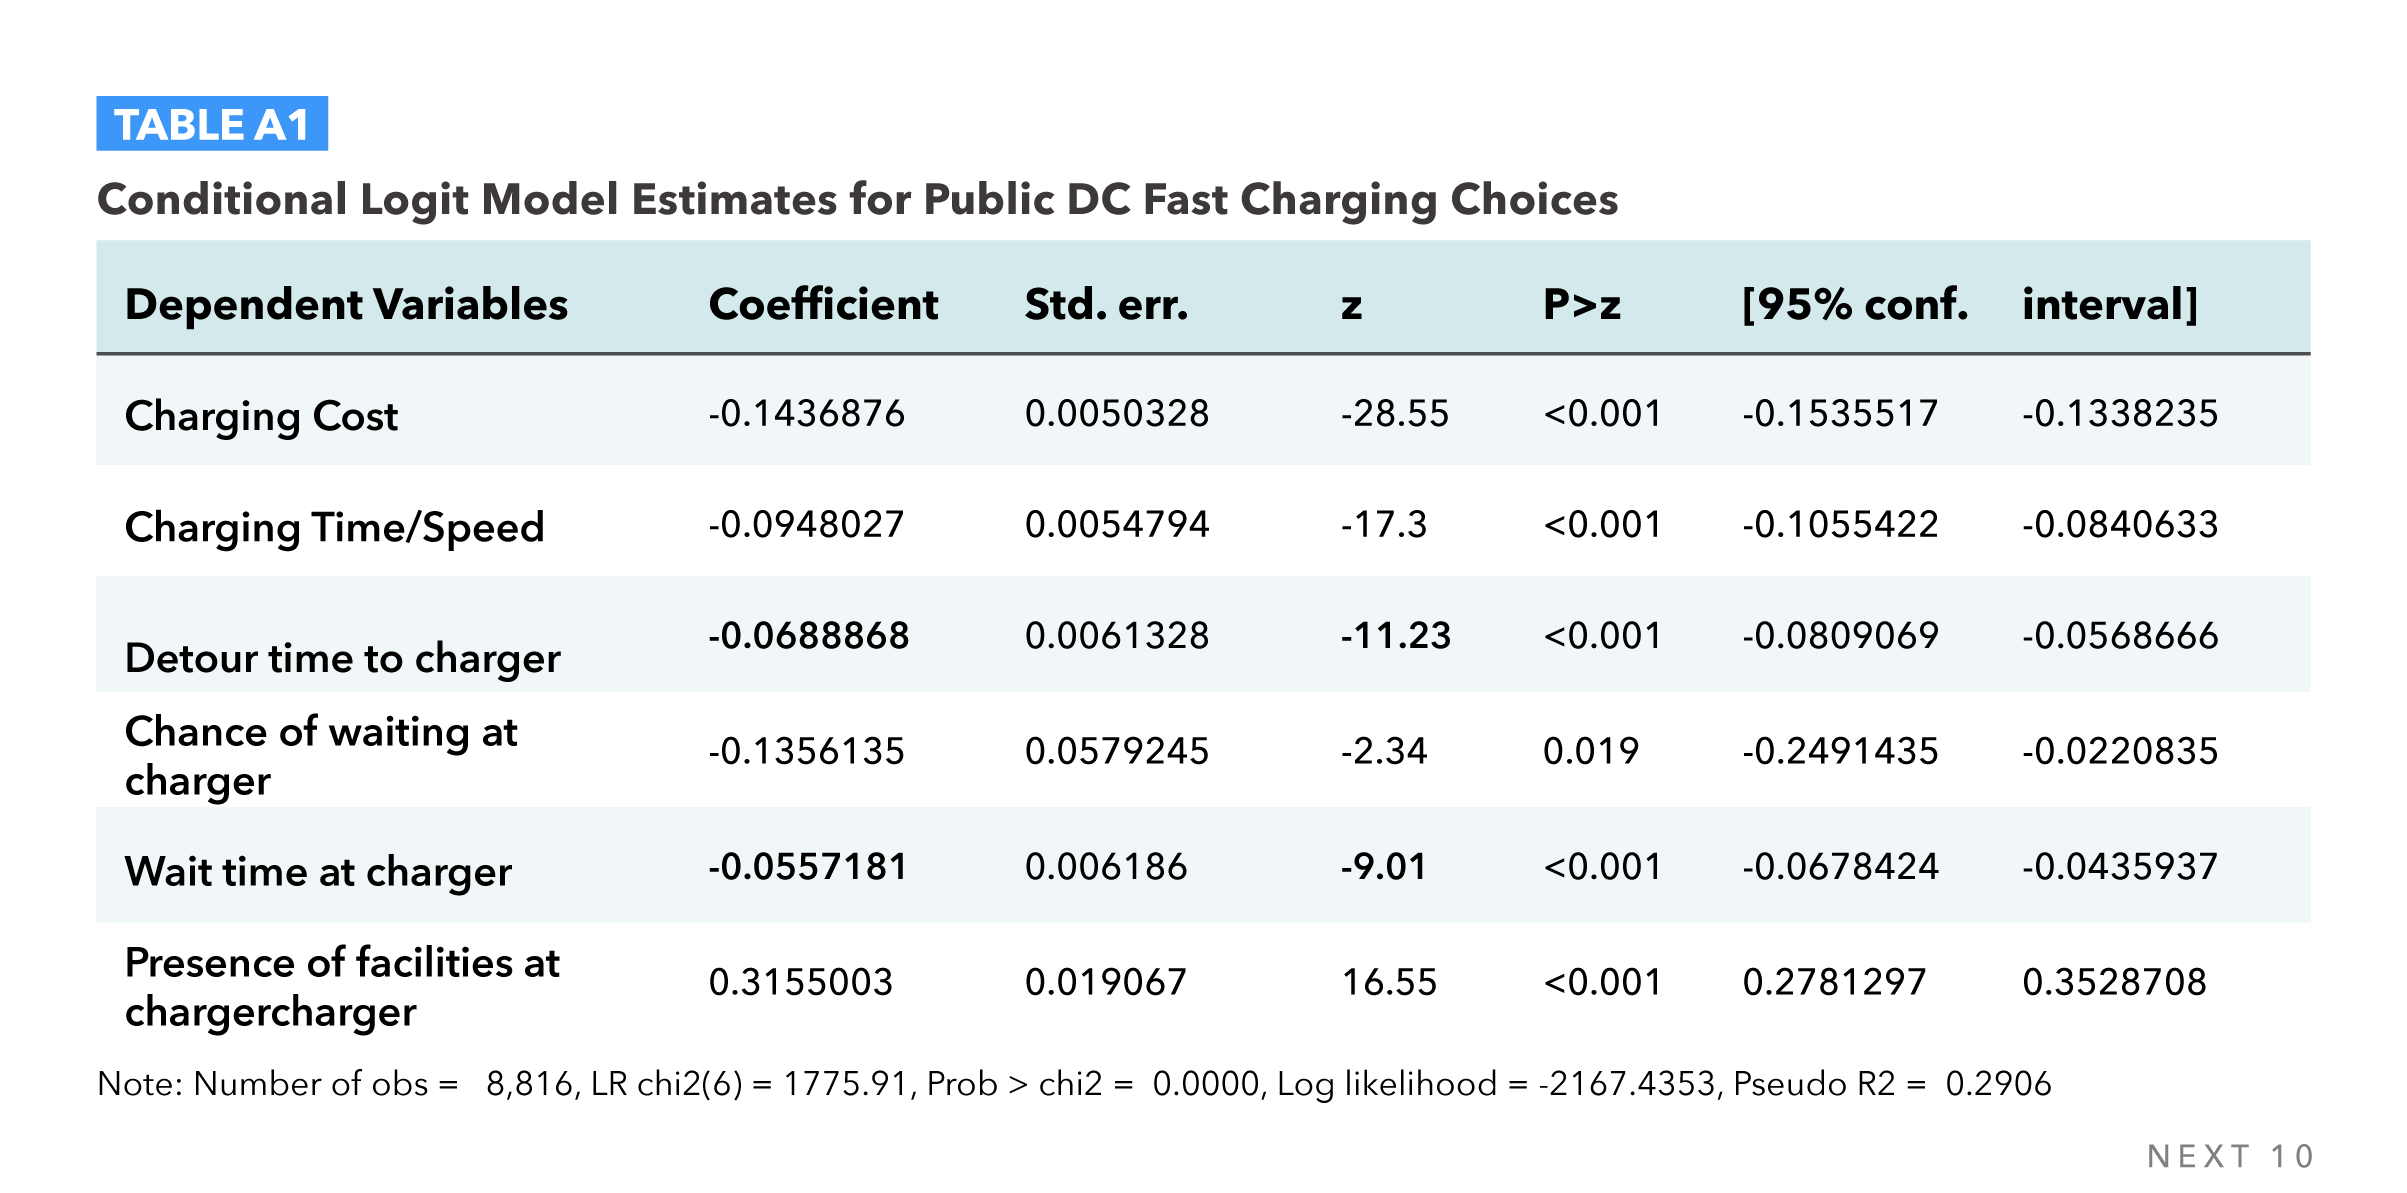
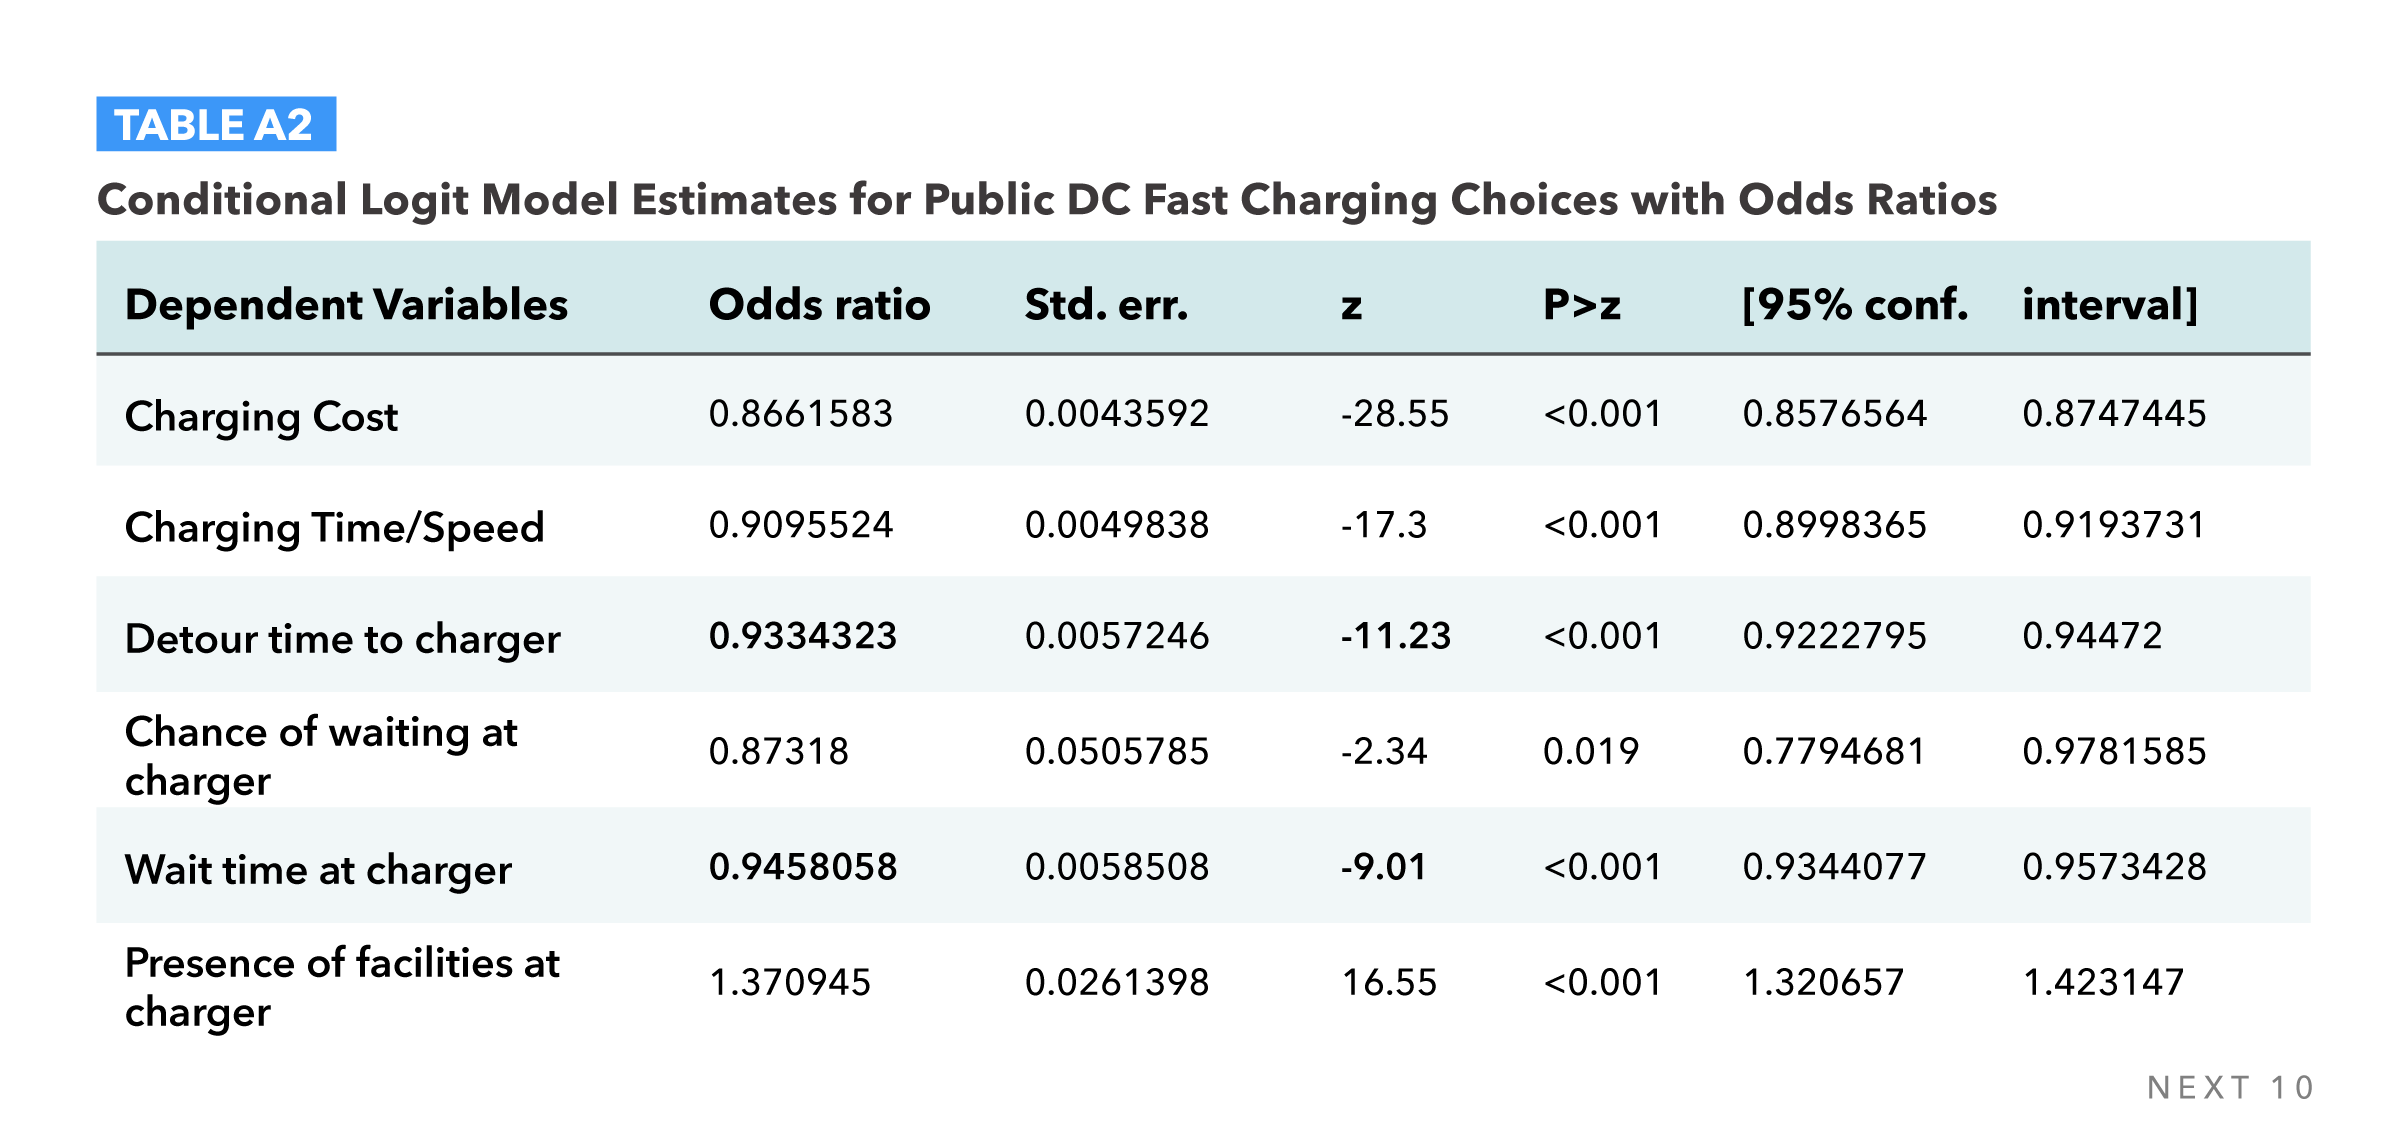
- Drivers are 37 percent more likely to choose a charger with additional amenities (for example, restrooms and convenience stores). Drivers are also more likely to choose chargers that are closer to travel routes, that have shorter wait times, and that have faster chargers.
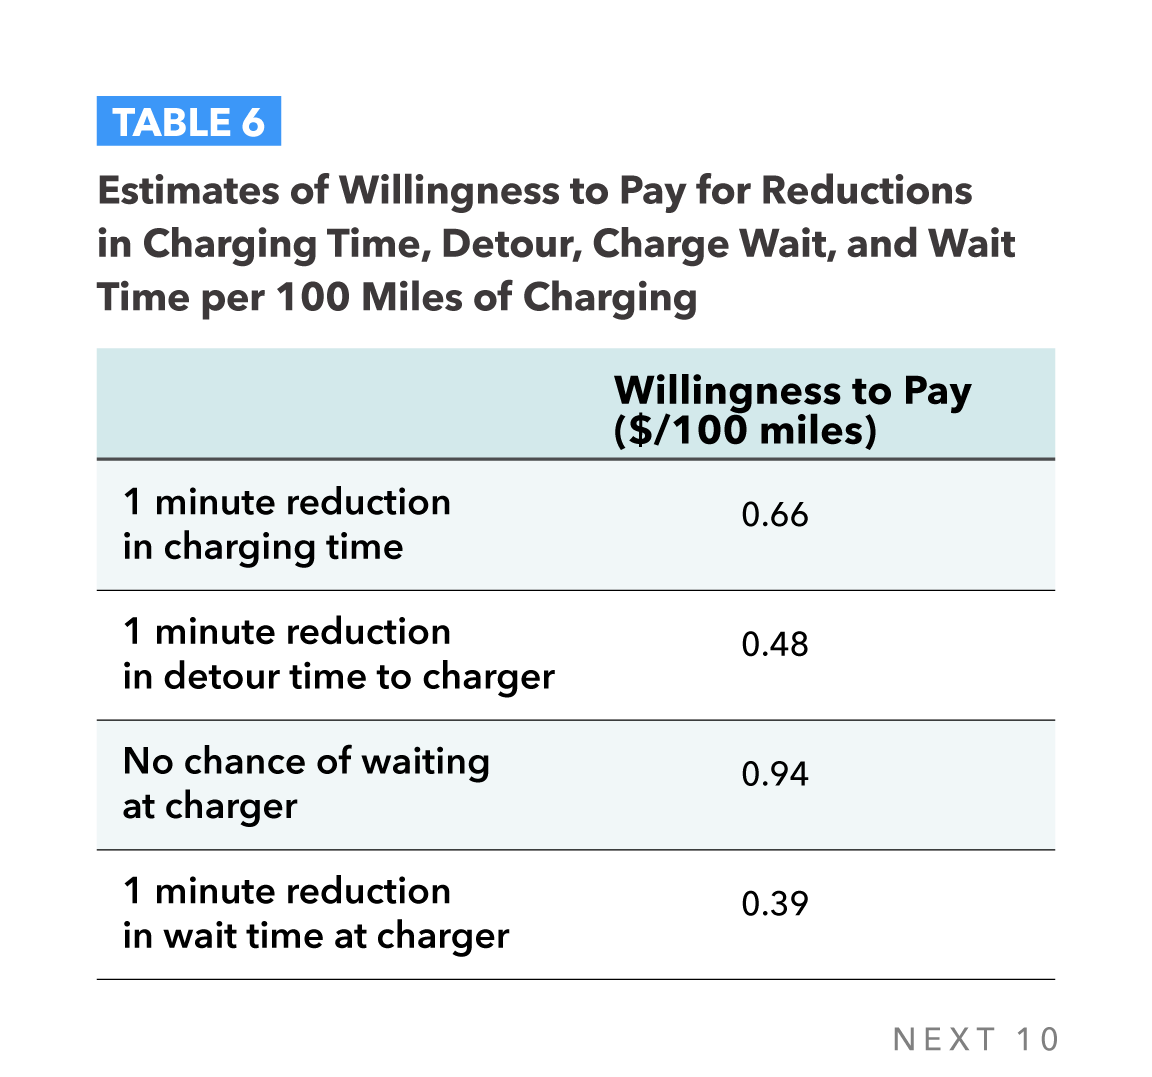
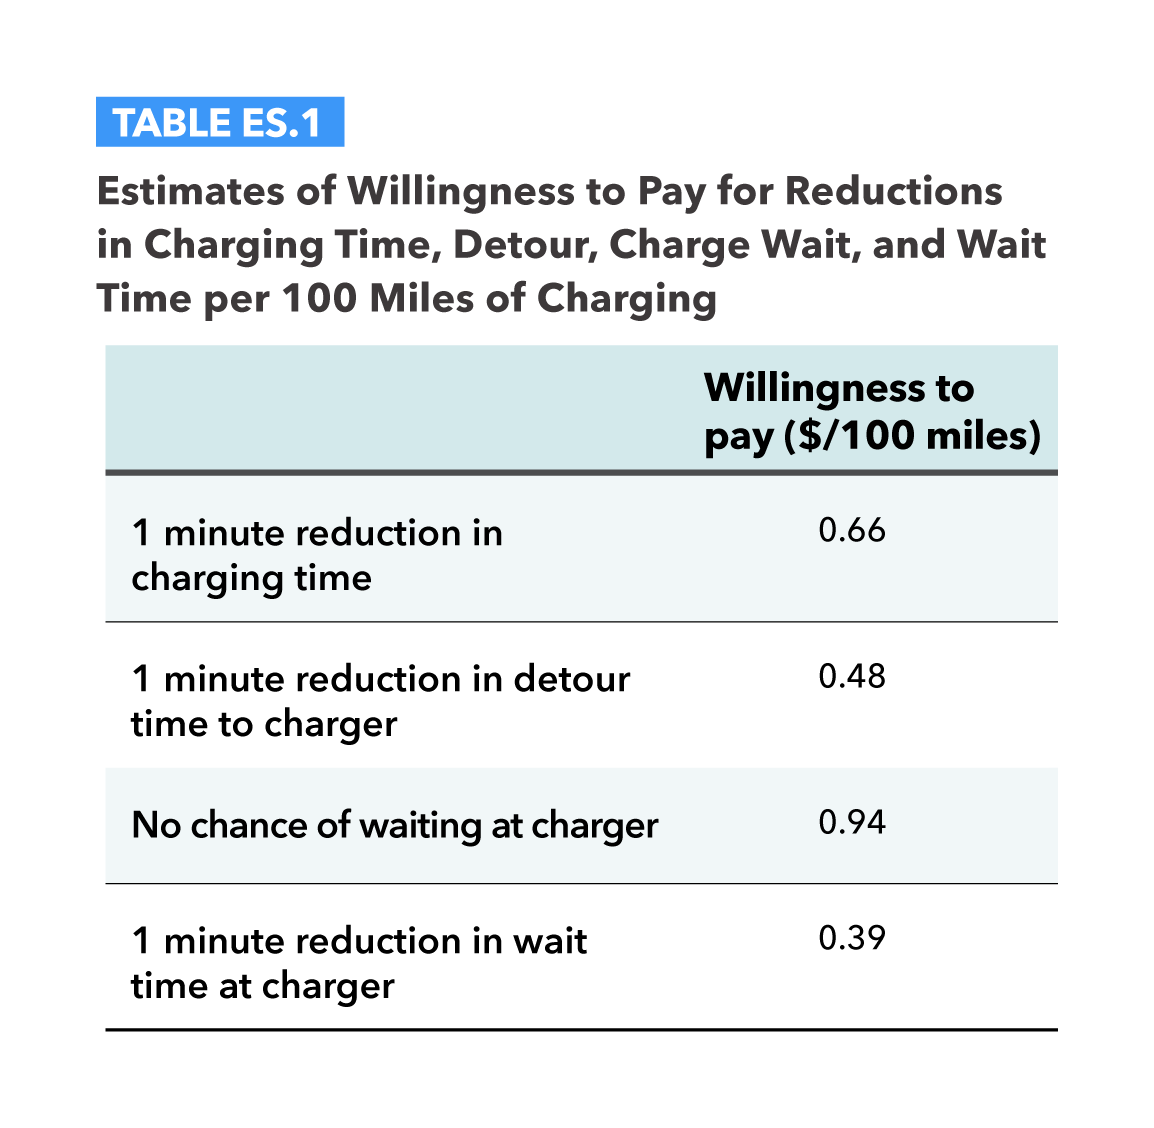
- EV drivers are willing to pay more for reductions in charging, wait, and detour time at public chargers.
Next 10 cannot grant permission to use graphics from this publication; additional permissions may be required from the copyright holder. Please view our Terms of Use policy for more information or contact Next 10 at info@next10.org with any questions.