Publications
The Economic Impacts of California's Major Climate Programs on the San Joaquin Valley
1st comprehensive cost/benefit study of climate policies in San Joaquin Valley finds over $13 billion in economic benefits, mostly in renewable energy.
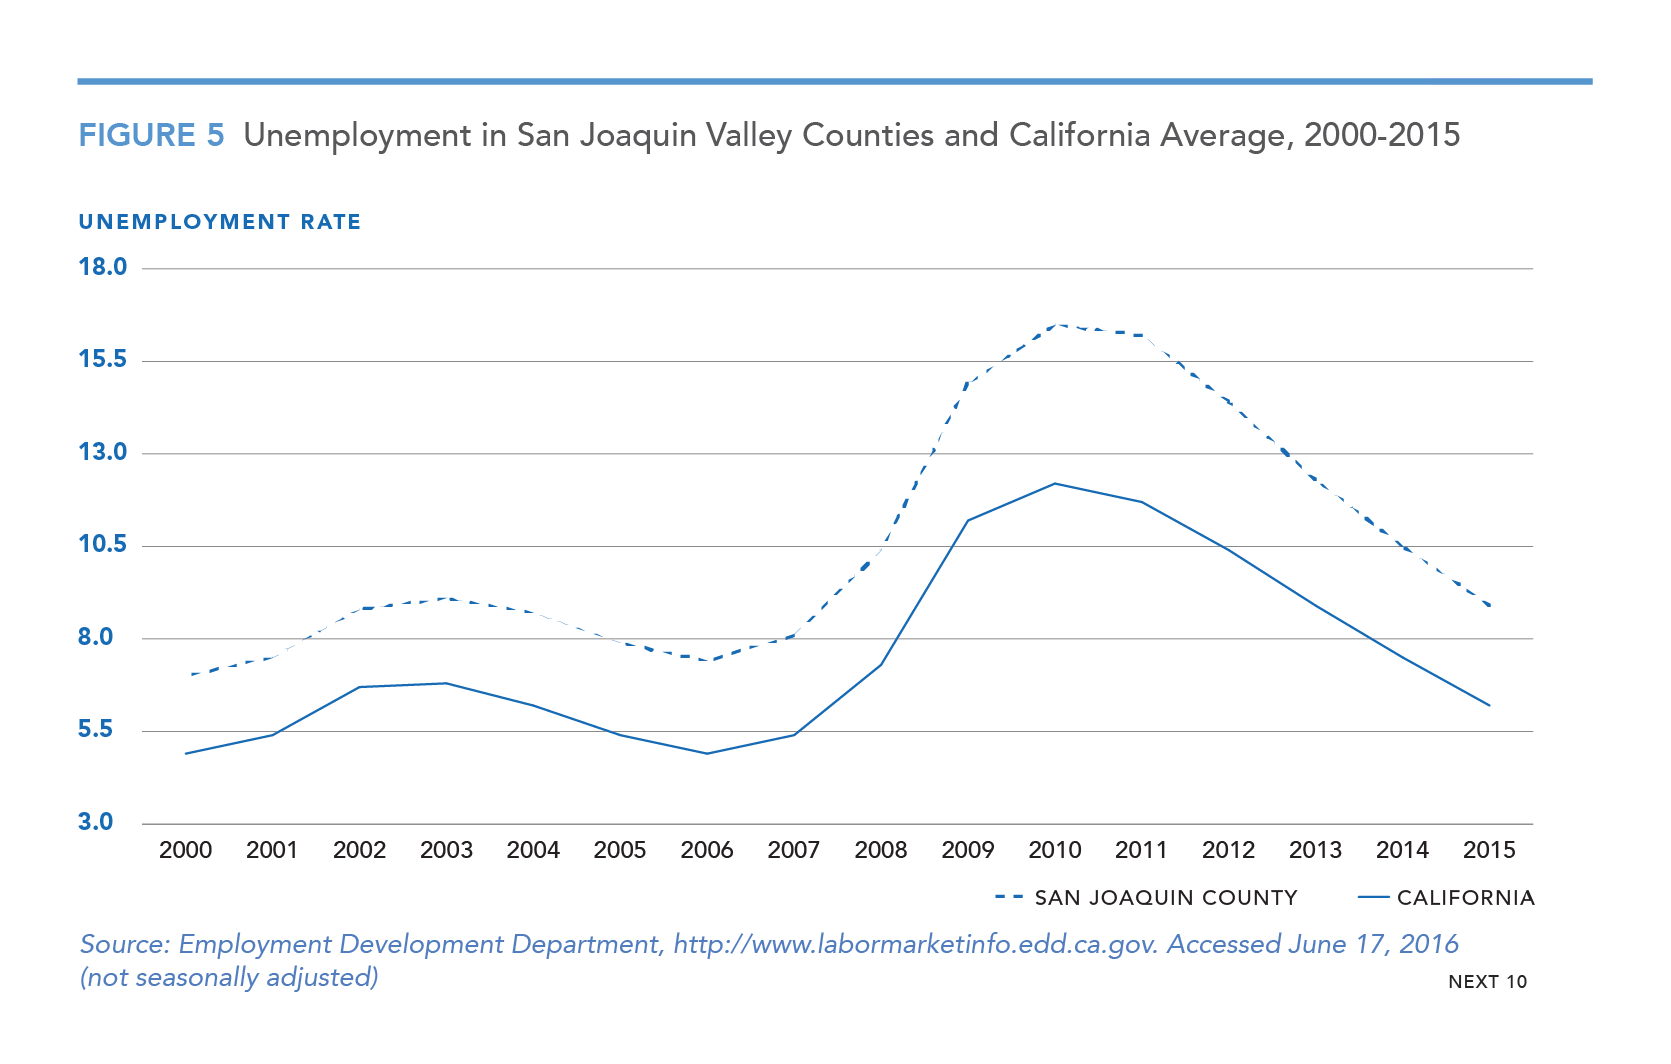
The report finds that California's ambitious climate policies resulted in a total economic benefit of $13.4 billion. The Economic Impacts of California's Major Climate Programs on the San Joaquin Valley addresses compliance and investment costs, as well as benefits across the region, and finds a net boost to the Valley's economy from the state's major climate programs, including the creation of tens of thousands of jobs. While the Valley is especially vulnerable to air quality problems that climate policies tend to alleviate, it also faces more socioeconomic challenges than other parts of the state and is less equipped to take chances with its economy.
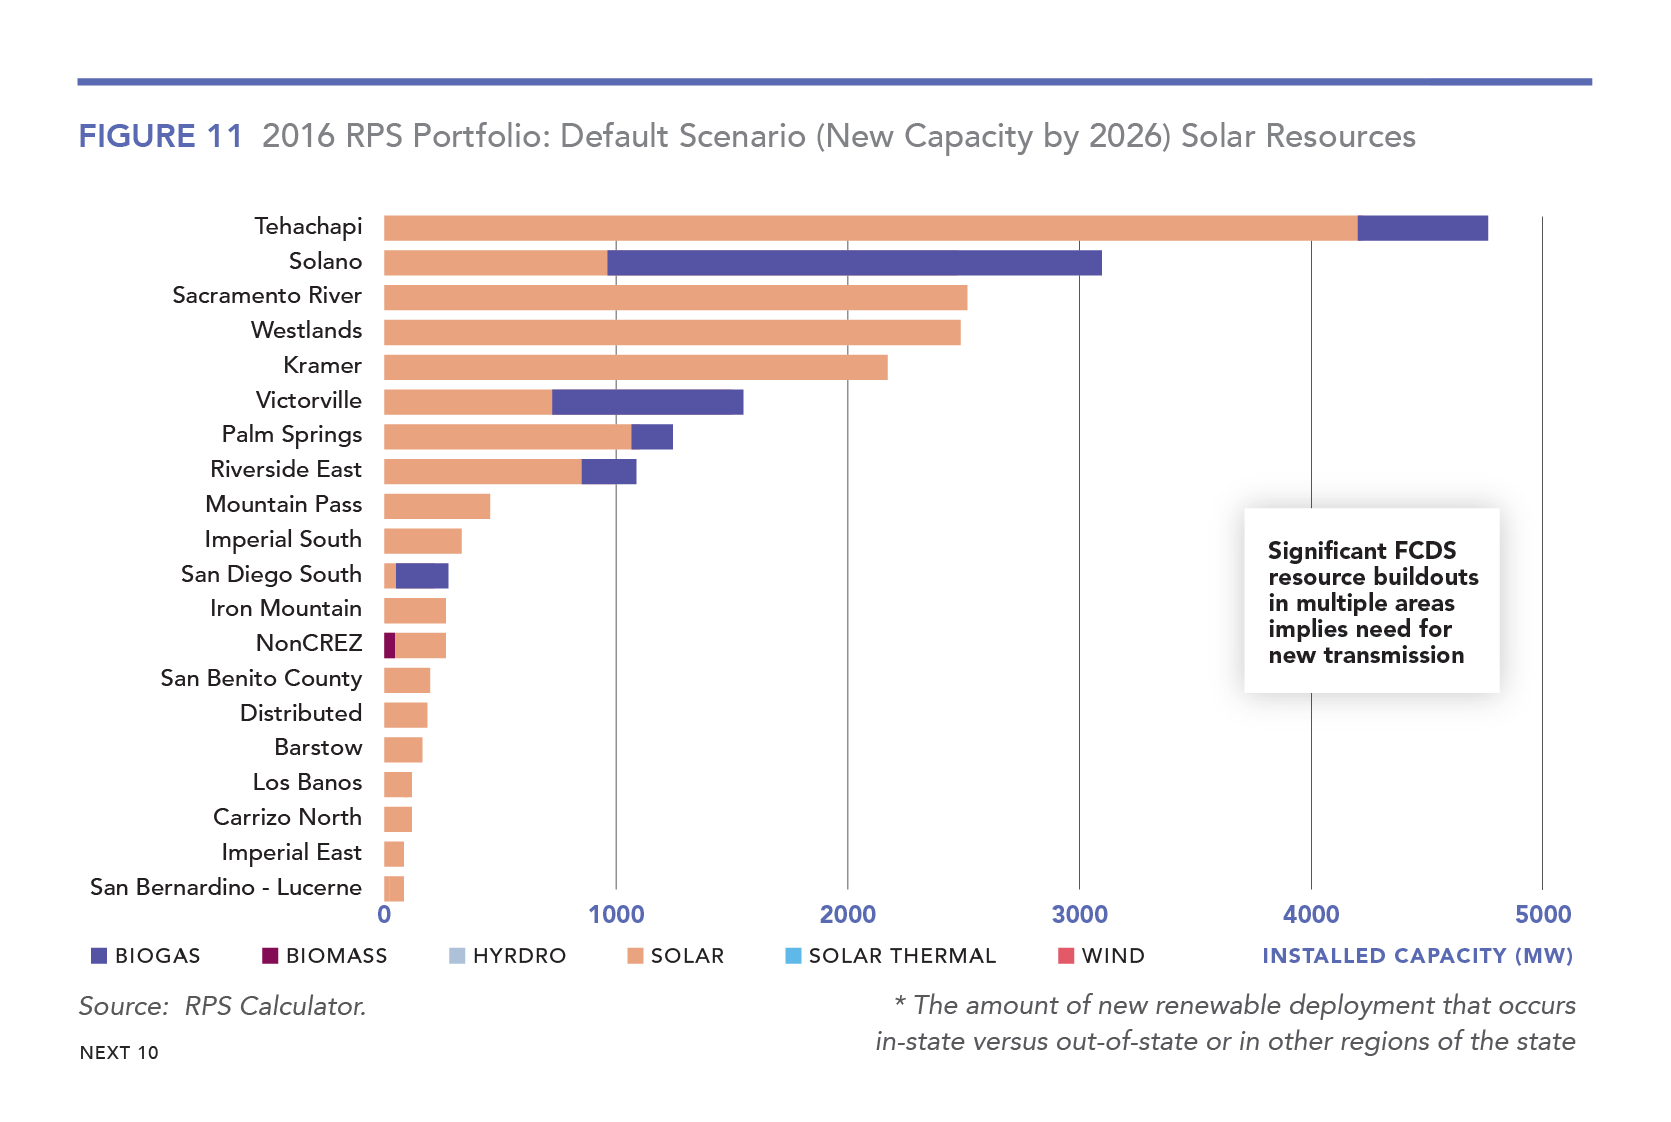
Researchers looked at three key California climate and clean energy policies: 1) cap and trade, which established a market designed to reduce carbon emissions from major polluters; 2) the renewables portfolio standard (RPS), which calls for California to get 33 percent of its energy from renewable sources by 2020, growing to 50 percent by 2030; and 3) energy efficiency programs run by investor-owned utilities and overseen by the Public Utilities Commission.
Next 10 does not own the rights to this publication. Usage of this content is subject to permissions, please contact us at info@next10.org for more information.
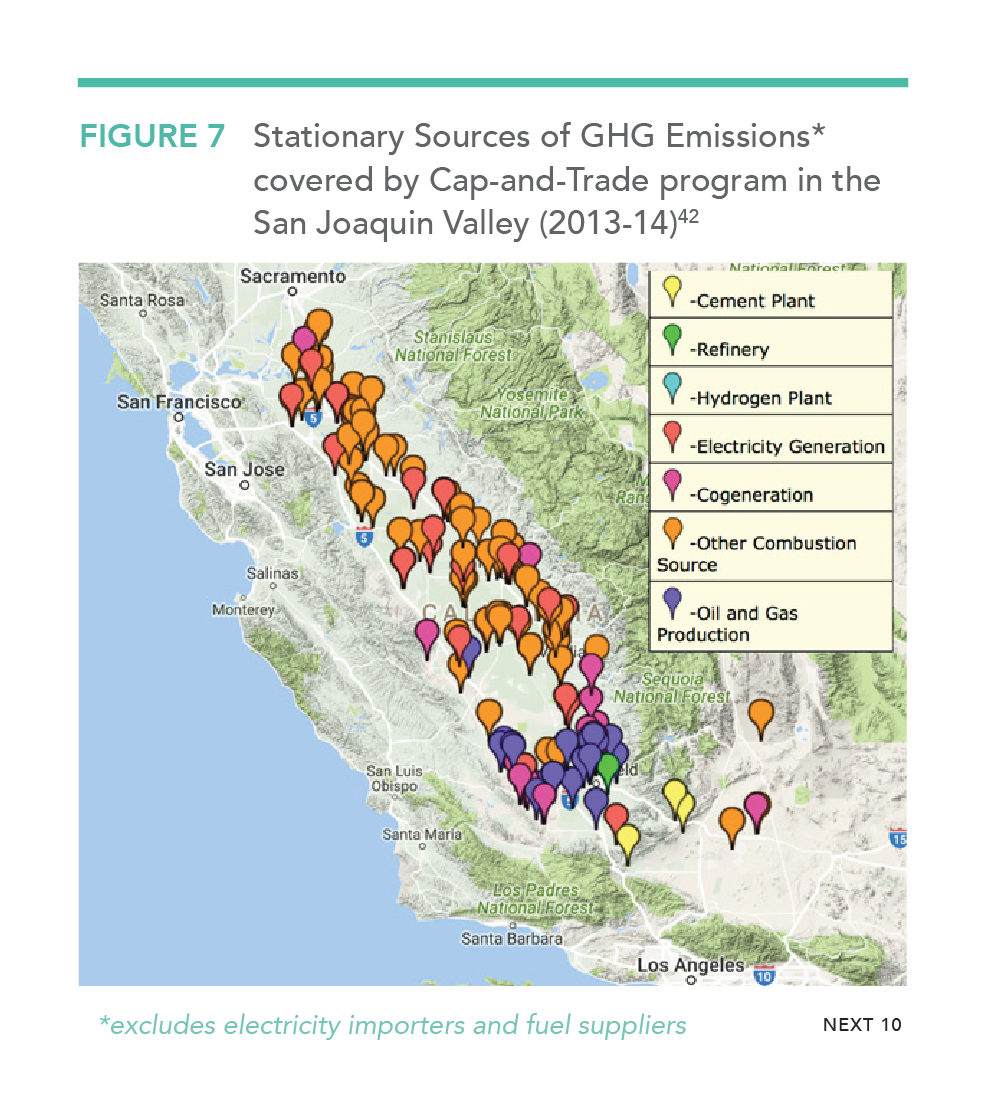
Cap and Trade:
- The cap-and-trade program had a direct economic benefit of $119 million to the San Joaquin Valley, and boosted the economy by $200 million when you include indirect and induced economic benefits.
- When cap-and-trade revenue that has been allocated but not yet disbursed is included, those numbers rise to $1 billion in direct economic benefits and $1.5 billion when including indirect economic benefits.
- There has been a potential negative impact on 400 jobs due to compliance, but researchers found that on a net basis, more than 700 jobs were created directly, and more than 1,600 supporting service and industry jobs were created indirectly, between 2013 and 2015.
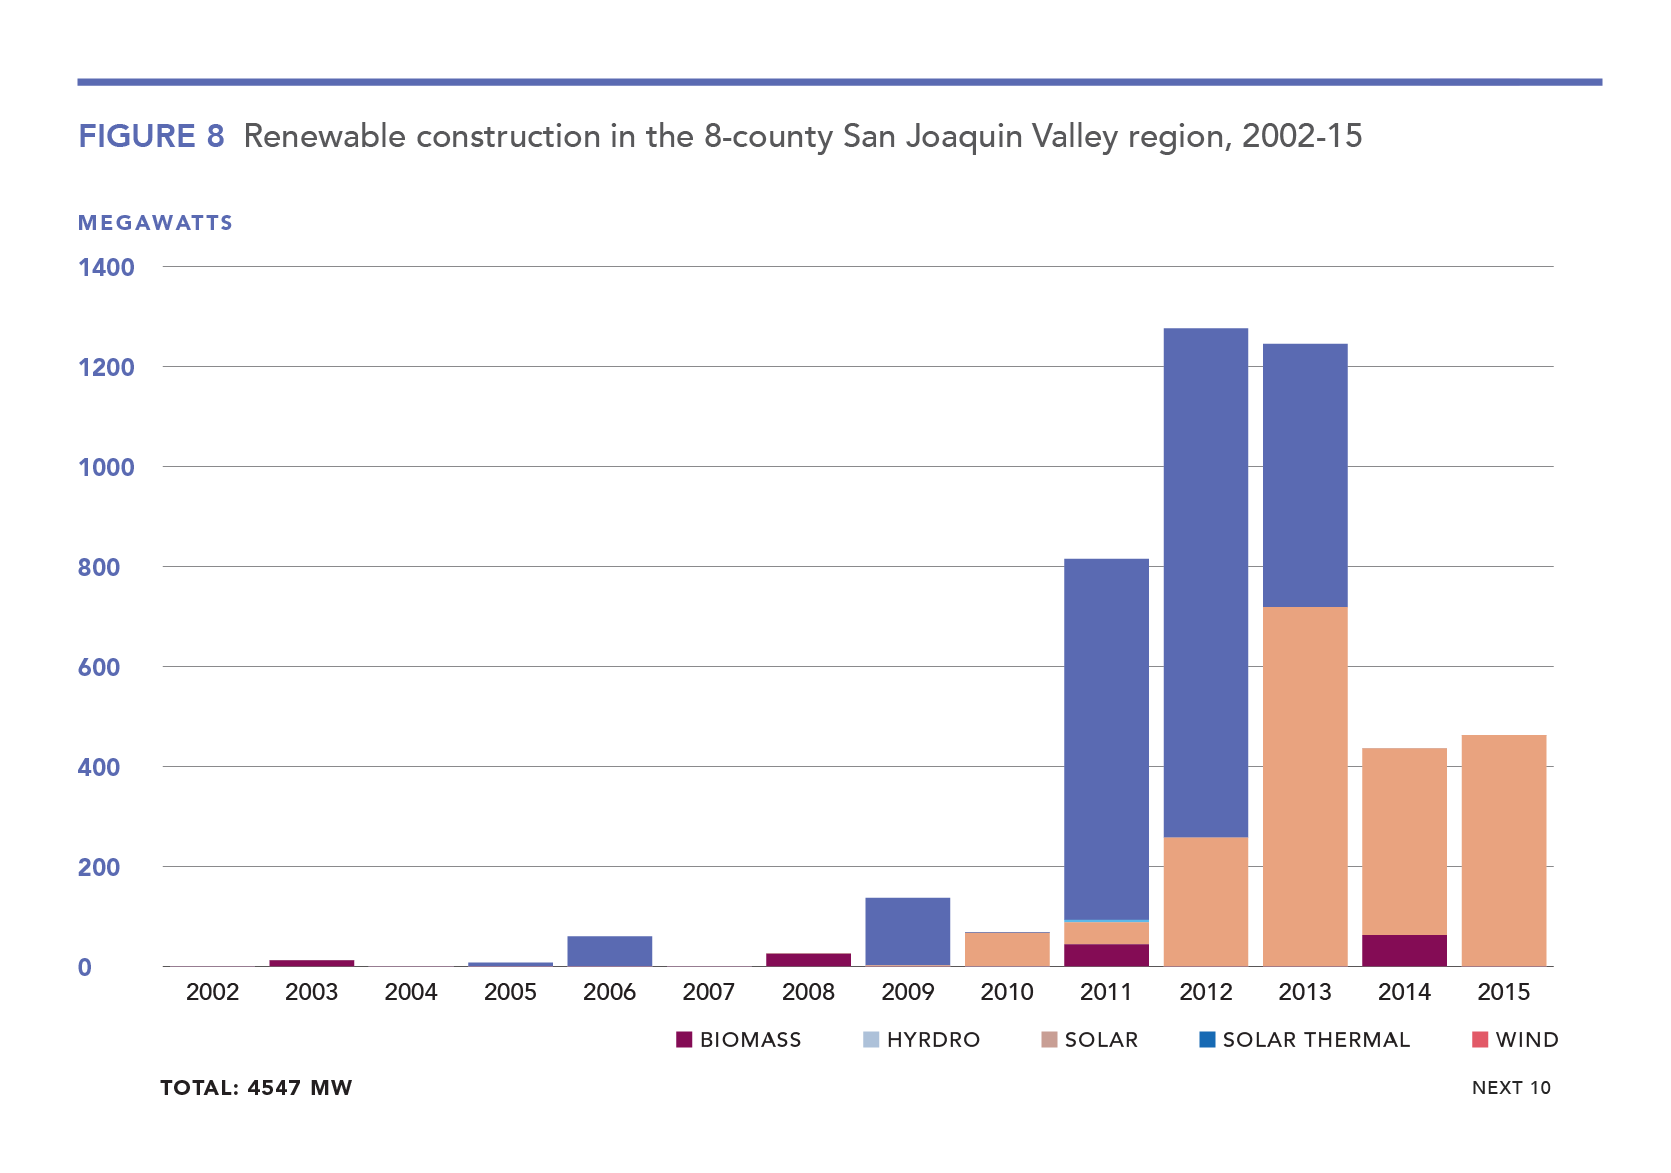
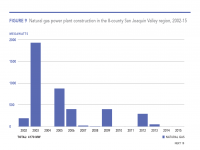
Renewables Portfolio Standard (RPS):
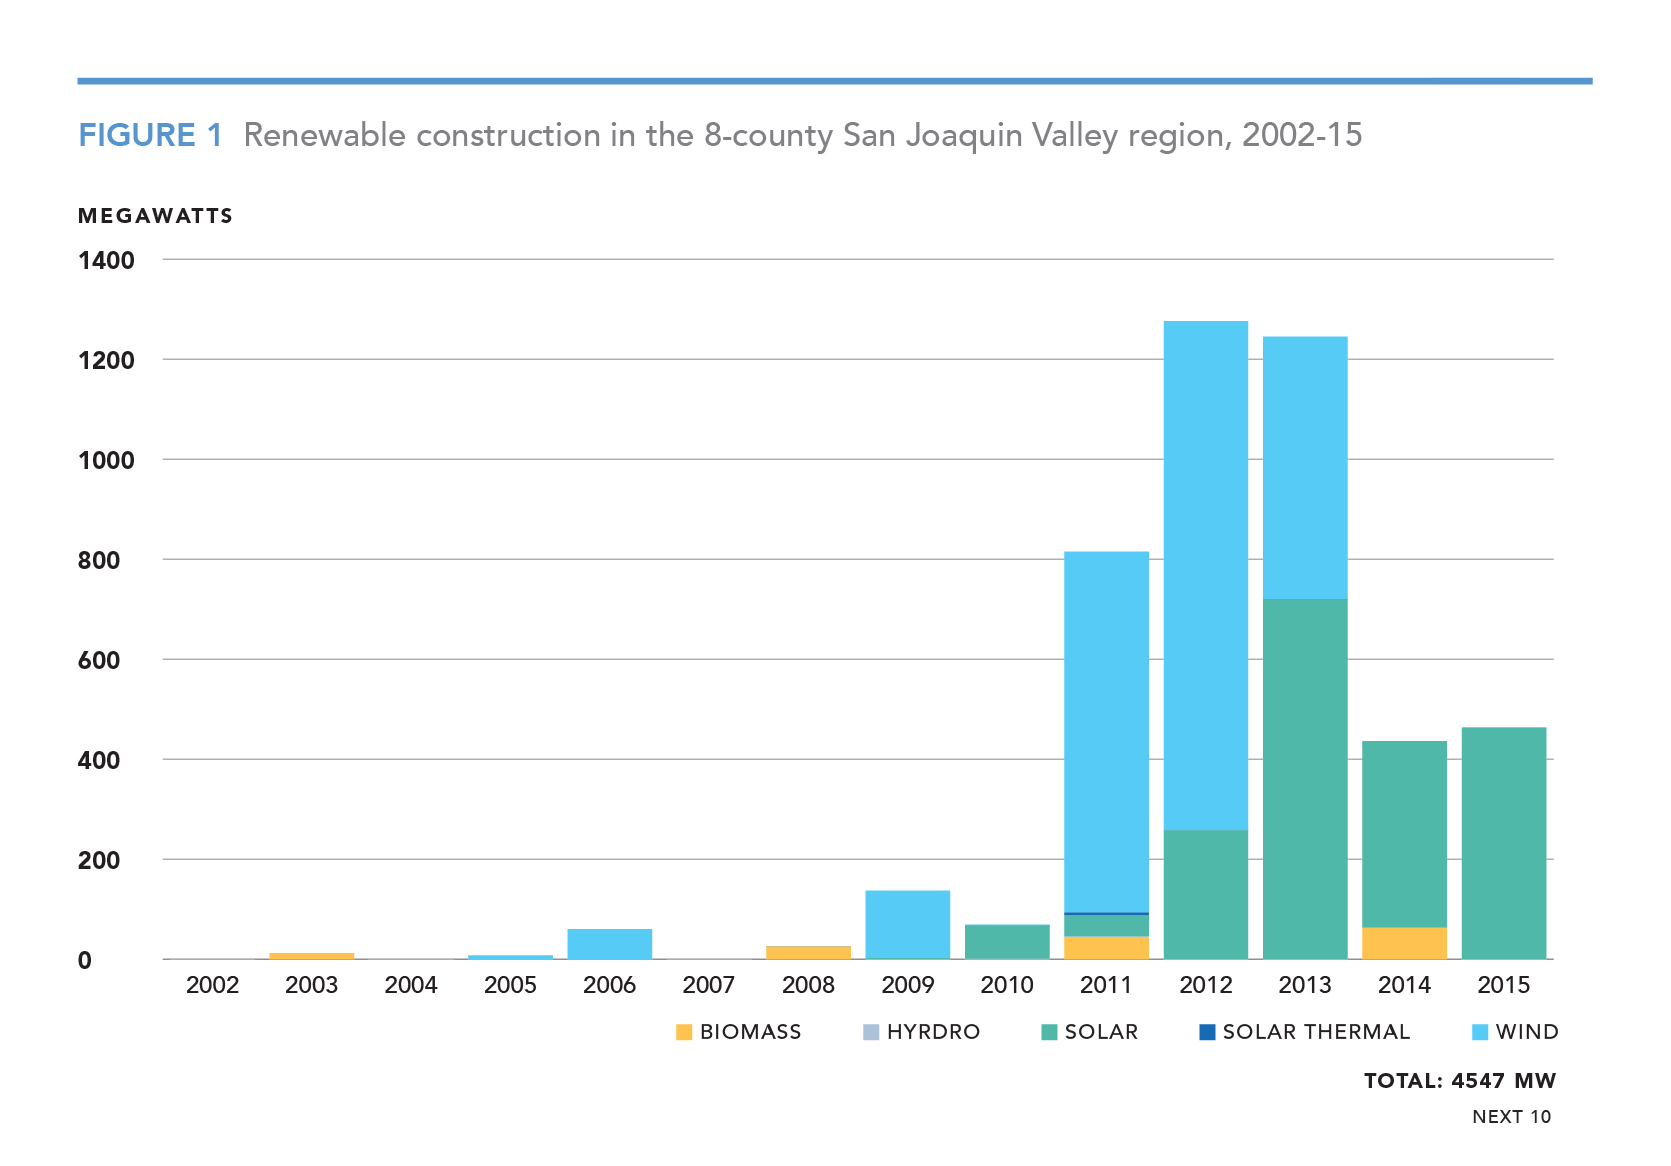
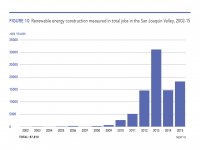
- Construction on renewable-energy projects has resulted in $11.6 billion in total economic activity in the Valley.
- The San Joaquin Valley is home to 24 percent of the state’s solar generation and 54 percent of the state’s wind generation
- From 2002 to 2015, renewable programs created about 31,000 direct jobs in the San Joaquin Valley—for people building and operating renewable-energy facilities, for example—and created another 57,000 indirect and induced jobs for suppliers, supporting businesses and the like, for a total of 88,000 jobs.
Energy Efficiency Programs:
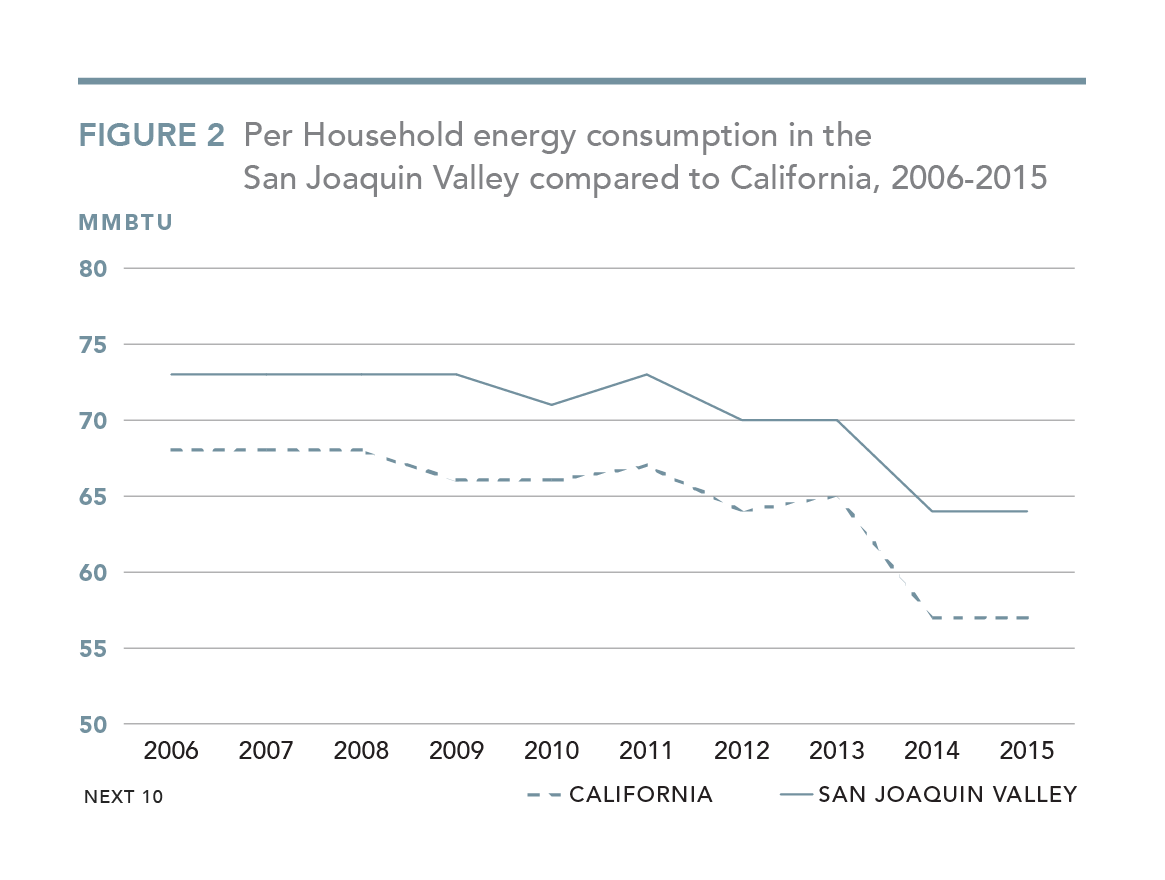
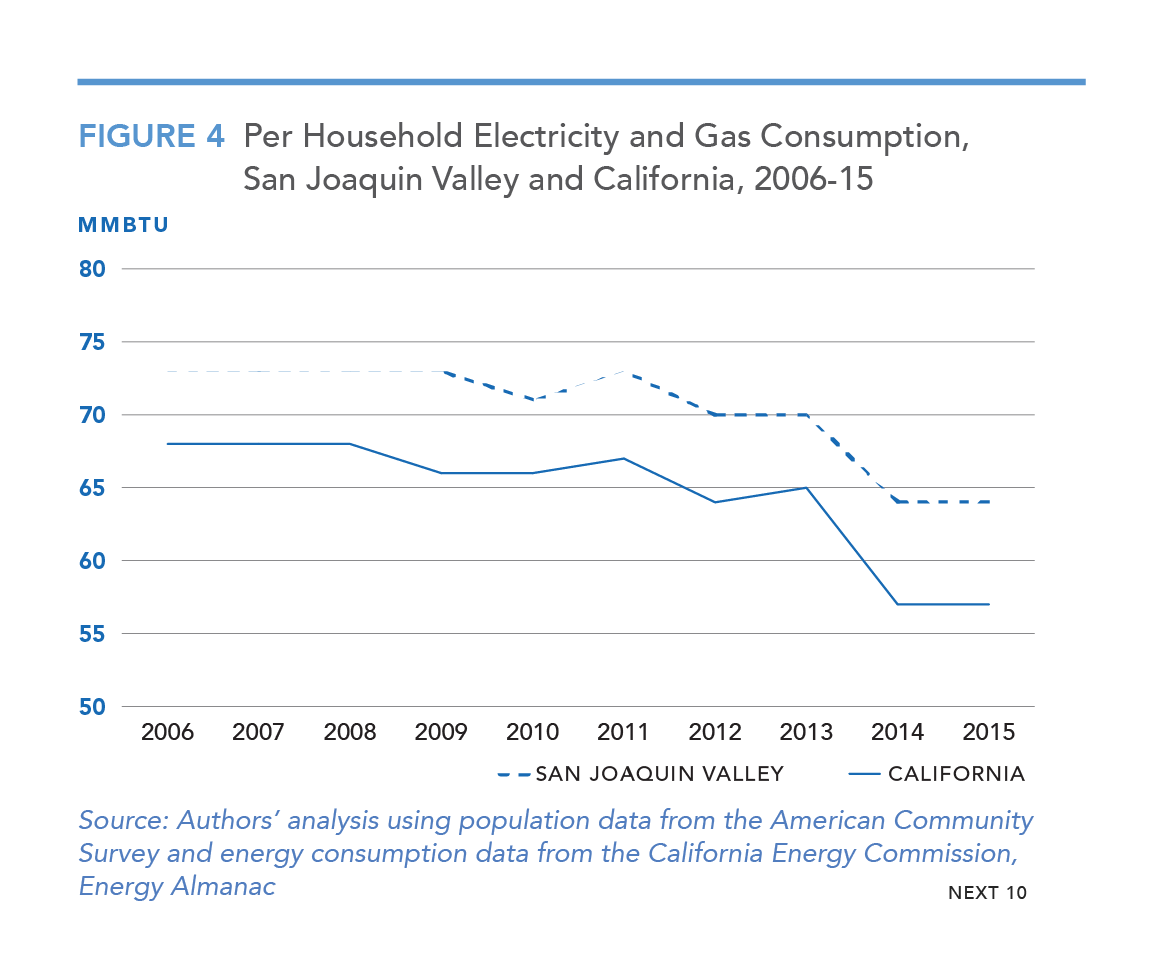
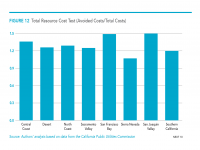
- Energy efficiency programs in the San Joaquin Valley are the most cost-effective in the state, having provided net economic benefits of $248 million in the Valley since 2010.
- From 2006 to 2015, utility energy efficiency programs created 6,700 direct jobs two-thirds of them in the construction industry and an additional 10,700 indirect and induced jobs, for a total of 17,400 jobs in the Valley.
Policy Recommendations:
- Remove uncertainty regarding the state's cap-and-trade program, especially as it relates to the allowance auction mechanism
- Ensure that cap-and-trade auction proceeds are spent on Valley programs that cut greenhouse gas emissions and co-pollutants
- Expand energy efficiency incentives in the Valley, where they yield greater energy savings than in more temperate parts of the state
- Develop robust transition programs for workers and communities affected by the decline of the region’s greenhouse gas-emitting industries
Next 10 cannot grant permission to use graphics from this publication; additional permissions may be required from the copyright holder. Please view our Terms of Use policy for more information or contact Next 10 at info@next10.org with any questions.