Publications
Growth Amid Dysfunction: An Analysis of Trends in Housing, Migration, and Employment
A trio of new studies suggest deepening divisions in California's economy, depending on residents' income and where they live. Some familiar trends continue.
Over the decade ending in 2016, more people moved out of California than moved in, and the state still has the highest housing costs in the nation. Job growth is up across low-, mid- and high-income earners, but while wages have increased across all categories, low-income earners haven’t seen their paychecks increase at a comparable pace in recent years. Well-educated, high-income earners continue to move to California, even as growth in high-wage employment has slowed. And as housing prices near an all-time high, Californians with low-paying jobs are leaving the state in search of more affordable lives, despite a growing number of available low-paying jobs.
Regional differences add another layer of complication. For example, in the Bay Area, the number of high-wage jobs continues to grow, and high-wage workers continue to move in. But in Southern California, shares of high- and middle-wage employment have declined. And Southern California and rural areas are losing more residents, on average, than other parts of the state.
Growth Amid Dysfunction is the Executive Summary of three related reports on housing, migration, and employment in California. To view the individual briefs, visit the Additional Resources tabs.


Current State of the California Housing Market:
- California has the highest home prices of any state. In 2016, the median California home price was $266,750 greater than the median home price in the U.S. as a whole.
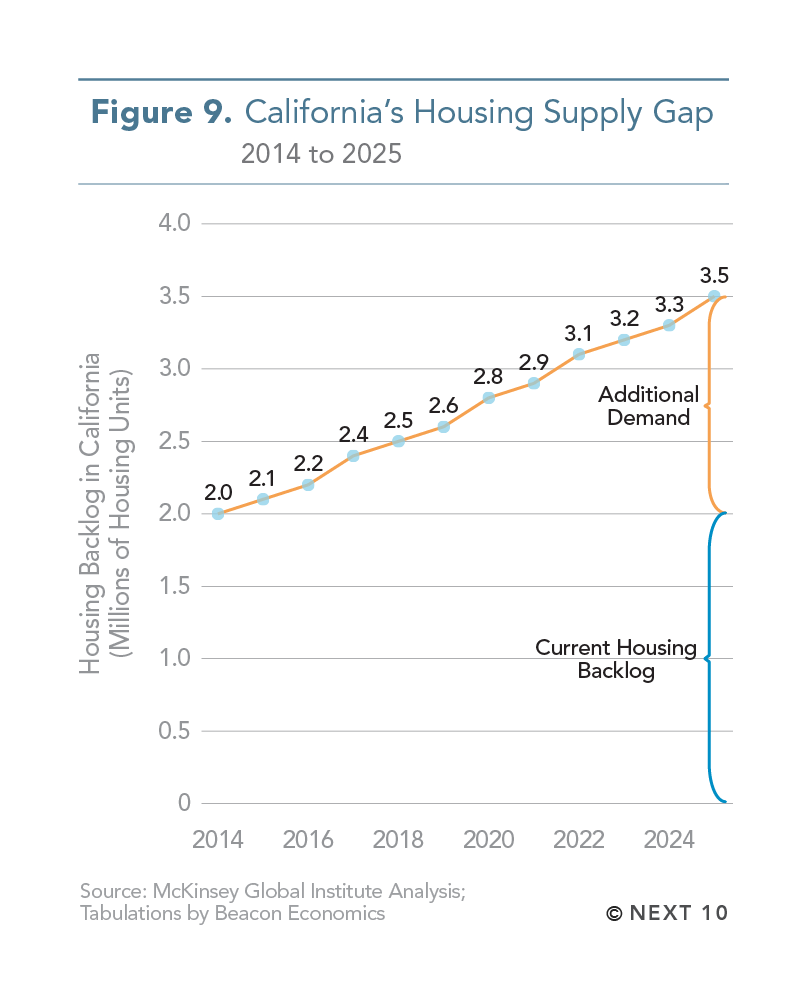
- Post-recession housing construction has been slow. From 2008 to 2017, an average of 73,000 new housing permits were issued per year—far lower than the average of 135,000 permits issued annually between 1991 and 2007.
- From 2007 to 2017, only 24.7 housing permits were filed for every 100 new residents in California—much lower than the U.S. average of 43.1 permits.
- California has the nation’s second-lowest rate of homeownership and worst rate of rental housing over-crowdedness in the country.
- For homeowners in California, the share of income spent on housing was 21.9 percent in 2016, down from 22.5 percent in 2014. California homeowners spend more on housing than homeowners in any other state except New Jersey.
- For renters, housing costs have decreased from 33.6 percent of income in 2014 to 32.8 percent of income in 2016. California ranks 48th of 50 states for this metric.
- Most jurisdictions are far behind the housing goals set by the 5th cycle of California’s Regional Housing Needs Assessment. Agricultural areas, including the Central Valley and Imperial County, are particularly far behind.
California Migration:
- From 2006 to 2016, 1,090,600 more people moved out of California to other states than moved from other states to California.
- The main driver for net out-migration appears to be high housing costs, since migration rates are highest for those at lower-wage levels. The vast majority of people who moved out of California were concentrated in lower-skilled, lower-paying fields — namely sales, transportation, and food preparation — which together accounted for a net outflow of more than 180,200 people from 2006 to 2016.
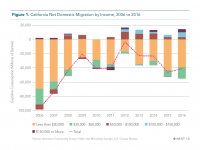
- Migration trends suggest that the middle class is also being priced out of the state. Net migration of those earning between $30,000 and $49,999 accounted for 93,500 residents leaving California from 2006 to 2016, or 18 percent of net out-migration. On the other hand, net domestic migration for households earning from $50,000 to $99,999 has been positive since 2010, representing 52 percent of net in-migration.
- The annual rate of net out-migration has fluctuated, and is recently on the rise, with 113,300 net residents leaving in 2016. That is, more people than left each year from 2009 to 2014, but not as many as the nearly 225,800 who moved out in 2006, when housing prices were sky-high ahead of the housing crash.
California Employment by Income:
- Compared to 10 years ago, average annual pay for low-wage earners in California — people making under $27,000 on average — has increased by only 17 percent. Middle-income earners — those making an average of $55,000 — have seen wages rise 29 percent. High-wage earners — those making an average of $83,000 — have seen a 42.5 percent increase.
- There are regional differences in employment patterns. The San Francisco-San Jose metropolitan statistical area saw the greatest growth in high-wage employment from 2007-2017 (16.9%), followed by San Diego (3.4%), while the rest of California’s major metro areas saw a decrease. Other parts of the state have lost high-wage and middle-wage jobs and have seen low-wage employment grow, particularly in more rural inland areas.
- Jobs in low- and middle-wage industry sub-sectors have been outpacing growth in high-wage subsectors from 2014 through Q2 2017, with 6.8, 6.8 and 4.3 percent growth, respectively.
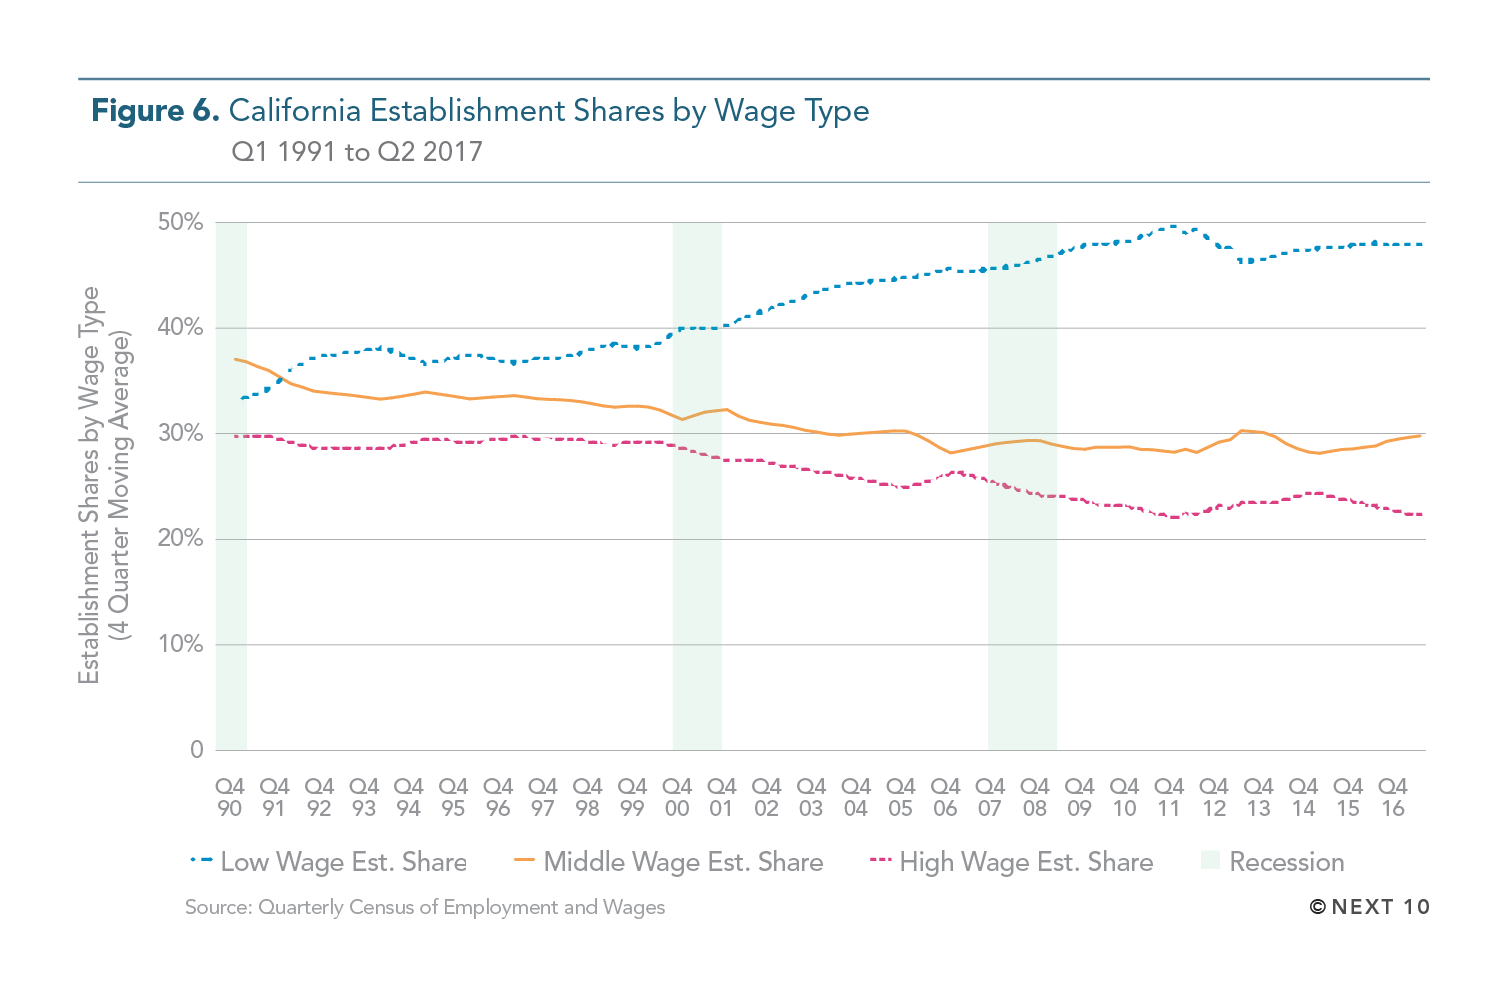
- Low wage industry growth in California has outpaced similar growth nationwide. Statewide, low-wage employment has increased from less than 25 percent of total jobs in 2001 to almost 30 percent in 2016. These jobs are concentrated in sub-sectors such as leisure and hospitality, retail, healthcare, and agriculture.
- Statewide, high-wage employment fell from almost 37 percent of workers to 33 percent from 2001 to 2016. These jobs are concentrated in sub-sectors such as professional and technical services, hospitals, and building construction.
Please visit the individual report pages for downloadable graphics: