Publications
California Employment By Income
A trio of new studies suggest deepening divisions in California's economy, depending on residents' income and where they live. Some familiar trends continue.
Over the decade ending in 2016, more people moved out of California than moved in, and the state still has the highest housing costs in the nation. Job growth is up across low-, mid- and high-income earners, but while wages have increased across all categories, low-income earners haven’t seen their paychecks increase at a comparable pace in recent years. Well-educated, high-income earners continue to move to California, even as growth in high-wage employment has slowed. As housing prices near an all-time high, Californians with low-paying jobs are leaving the state in search of more affordable lives, despite a growing number of available low-paying jobs.
Regional differences add another layer of complication. For example, in the Bay Area, the number of high-wage jobs continues to grow, and high-wage workers continue to move in, but in Southern California, shares of high- and middle-wage employment have declined. Southern California and rural areas are losing more residents, on average, than other parts of the state.
On the employment and income front, California’s economic growth is becoming increasingly concentrated in fewer industries. In high-wage sectors, California is adding more jobs at fewer establishments in the Professional and Technical Services sector, concentrating employment at fewer companies, even as incomes in this category continue to rise. This puts the state at risk of economic fallout should these sectors experience a downturn.
On the other end of the economic spectrum, the state is adding more jobs and more establishments in the low-wage sector than in any other part of its economy. However, incomes for low-wage earners have not risen enough for people in this category to afford California's high and increasing cost of living.
Next 10 owns the rights to this publication. Any usage of content from this publication is subject to our Terms of Use.
- Compared to 10 years ago, average annual pay for low-wage earners in California—people making under $27,000 on average—has increased by only 17 percent.
- Middle-income earners—those making an average of $55,000—have seen wages rise 29 percent.
- High-wage earners— those making an average of $83,000—have seen a 42.5 percent increase.
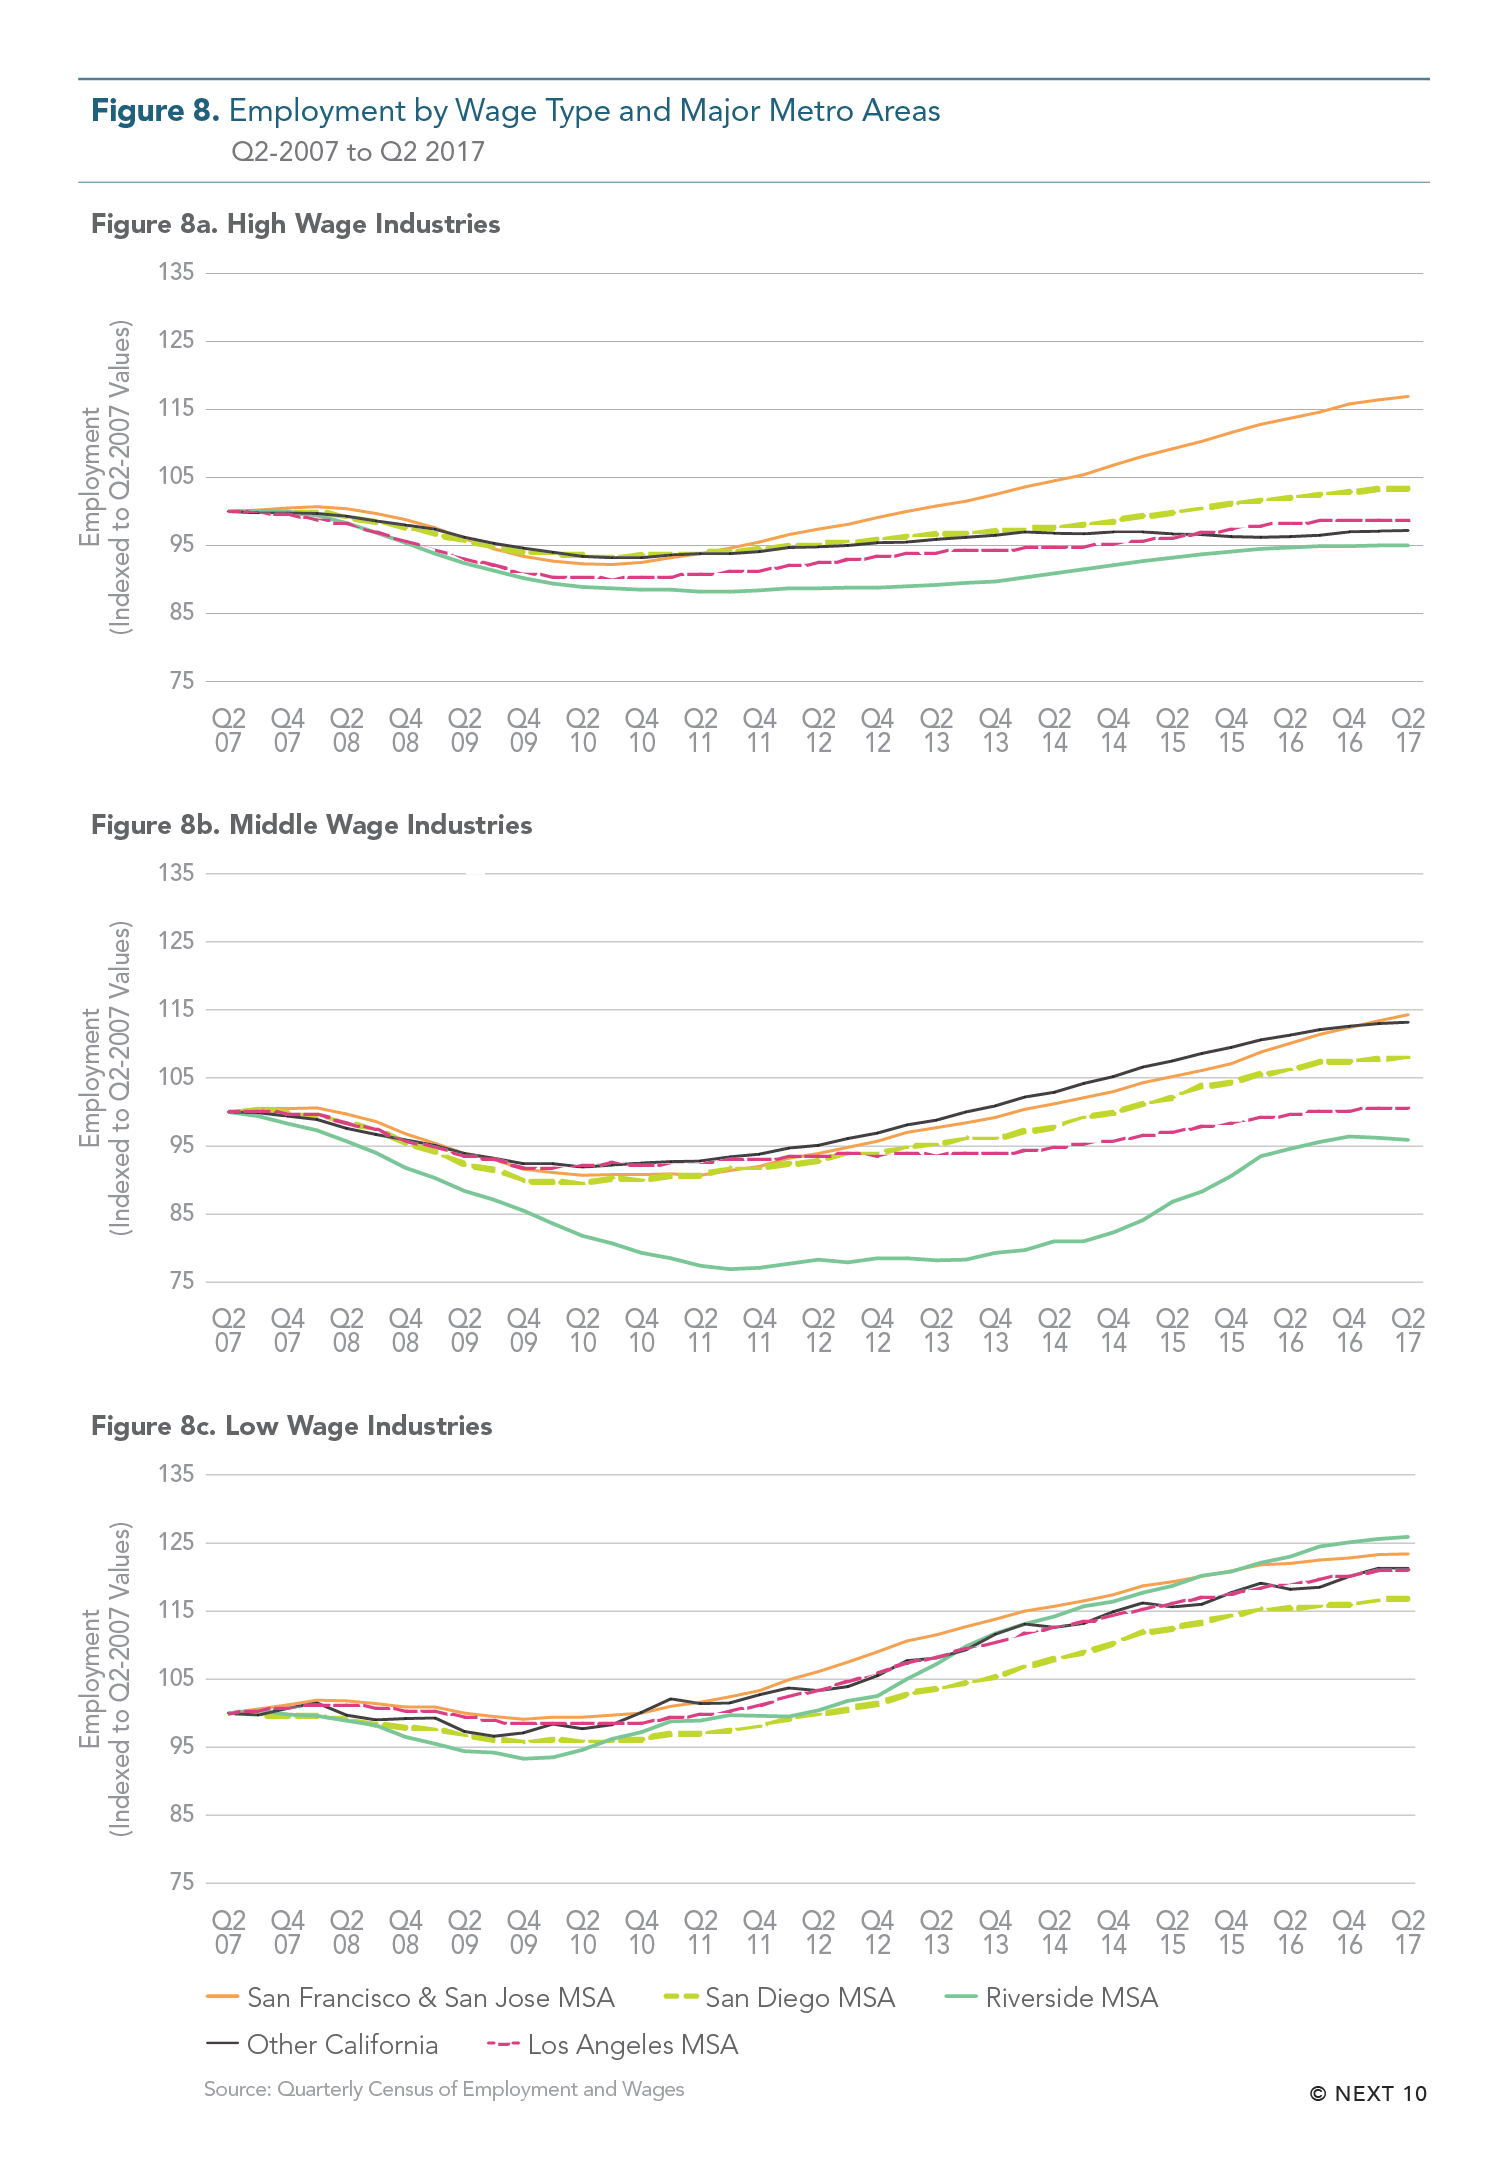
- There are regional differences in employment patterns.
- The San Francisco-San Jose metropolitan statistical area saw the greatest growth in high-wage employment from 2007-2017 (16.9%), followed by San Diego (3.4%), while the rest of California’s major metro areas saw a decrease.
- Other parts of the state have lost high-wage and middle-wage jobs and have seen low-wage employment grow, particularly in more rural inland areas.
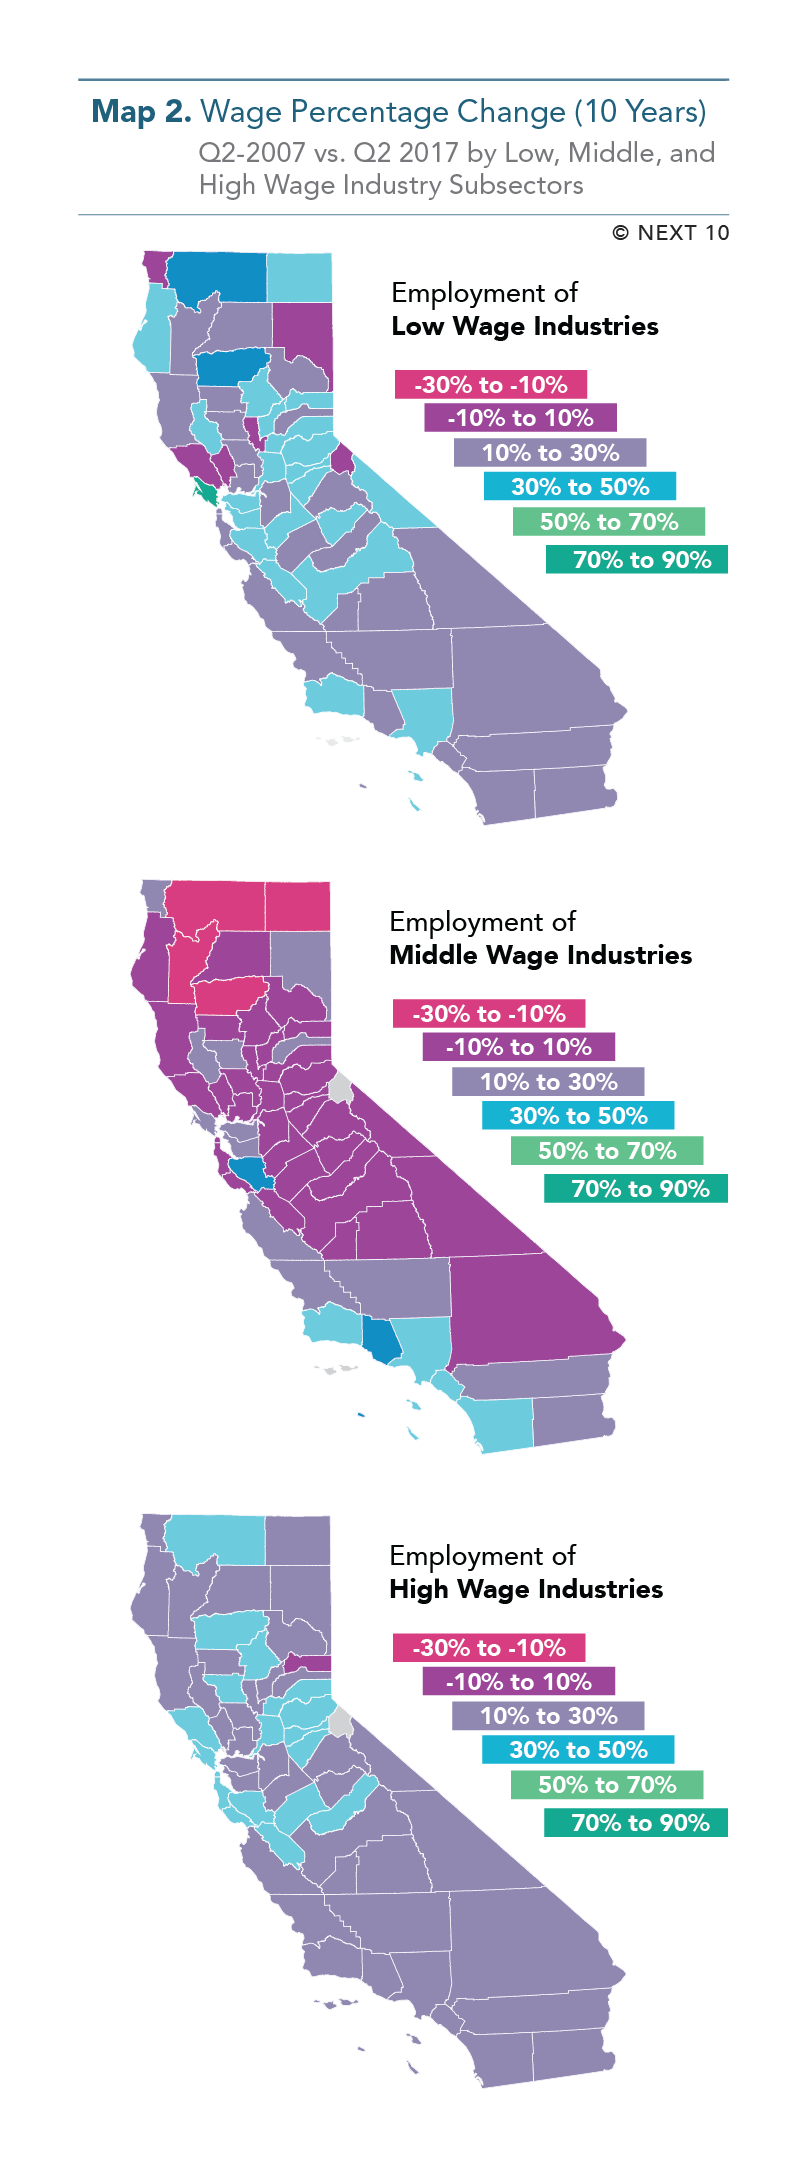
- No county saw a decrease in low or high-wage sub-sector wages from 2007 to 2017.
- Thanks to the recent tech boom, San Francisco, San Mateo, and Santa Clara counties saw 45.6 percent, 88.1 percent, and 64.3 percent increases in wages, respectively, during the ten-year period.
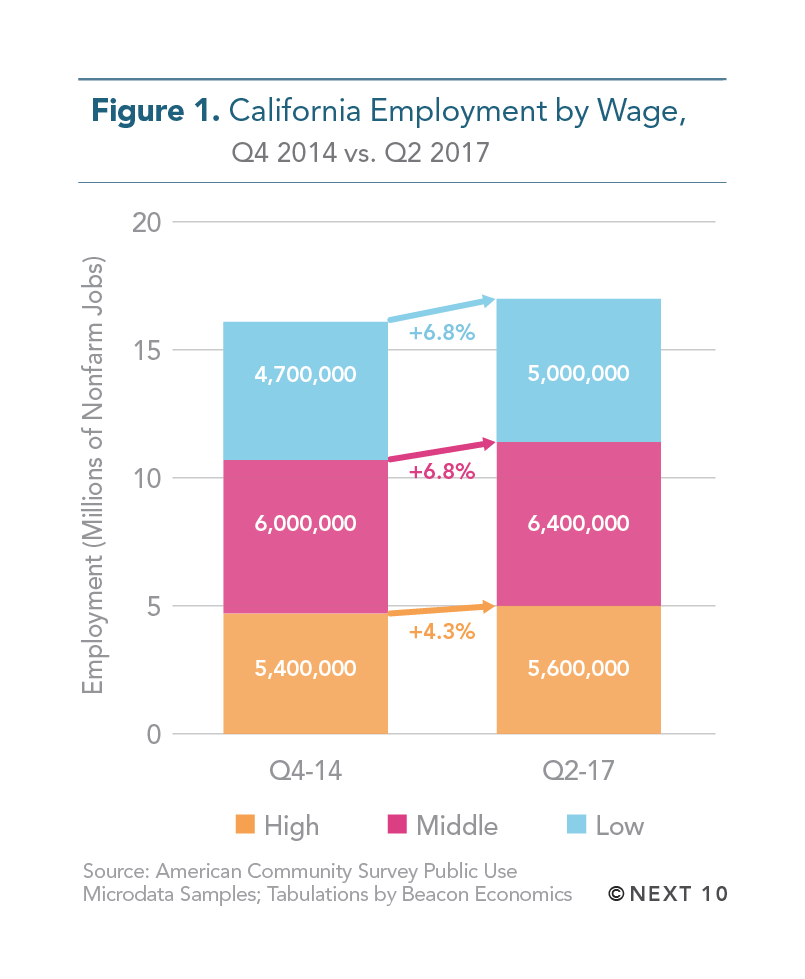
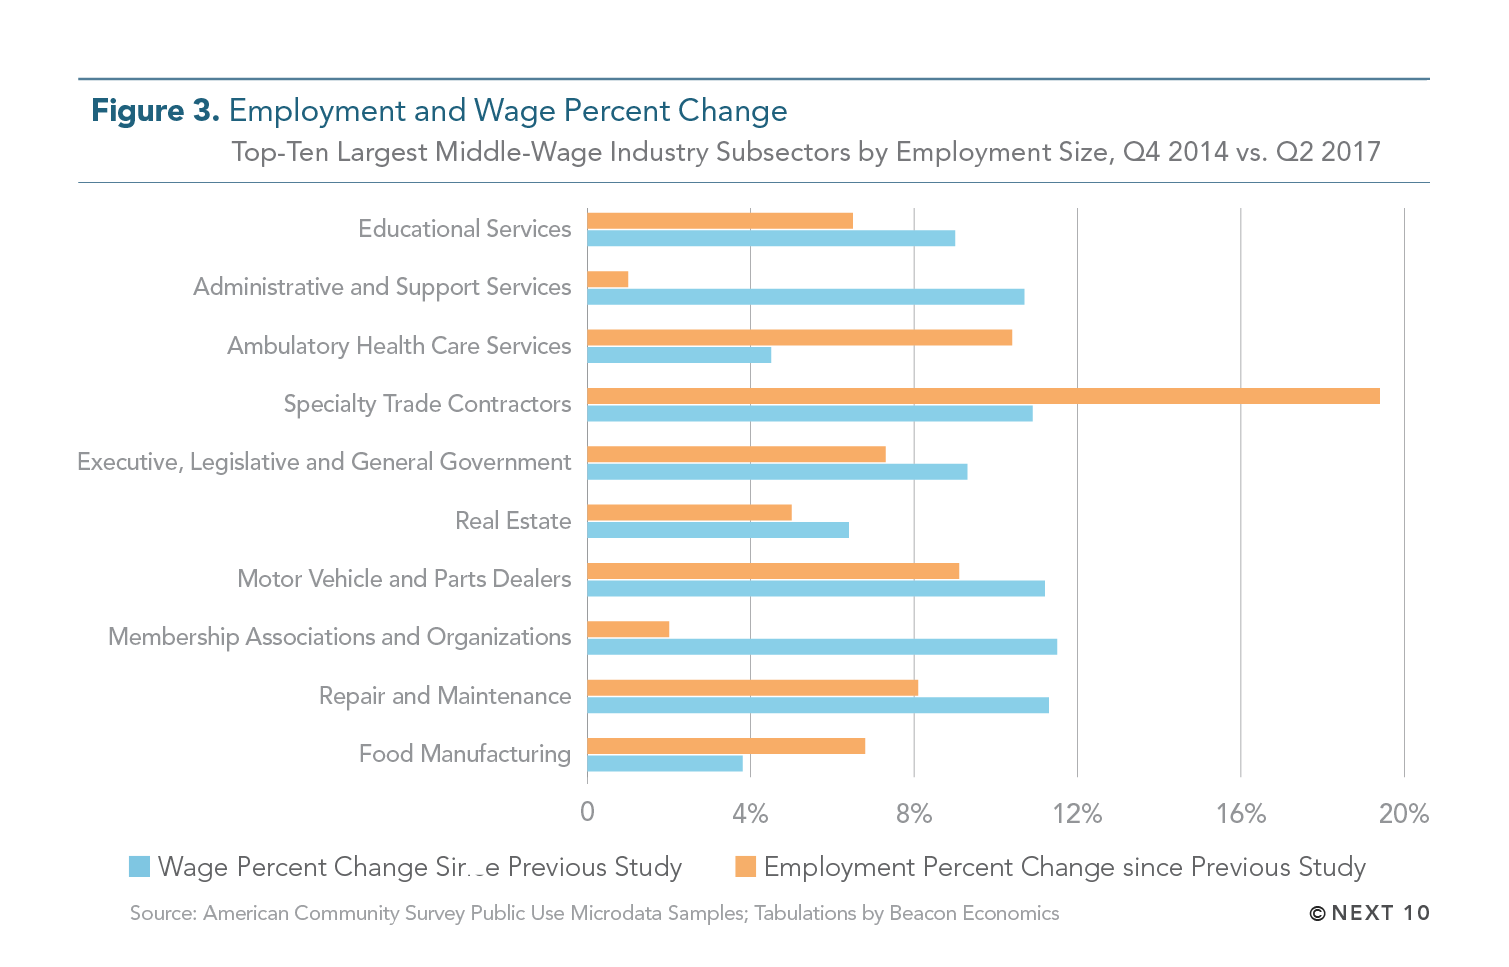
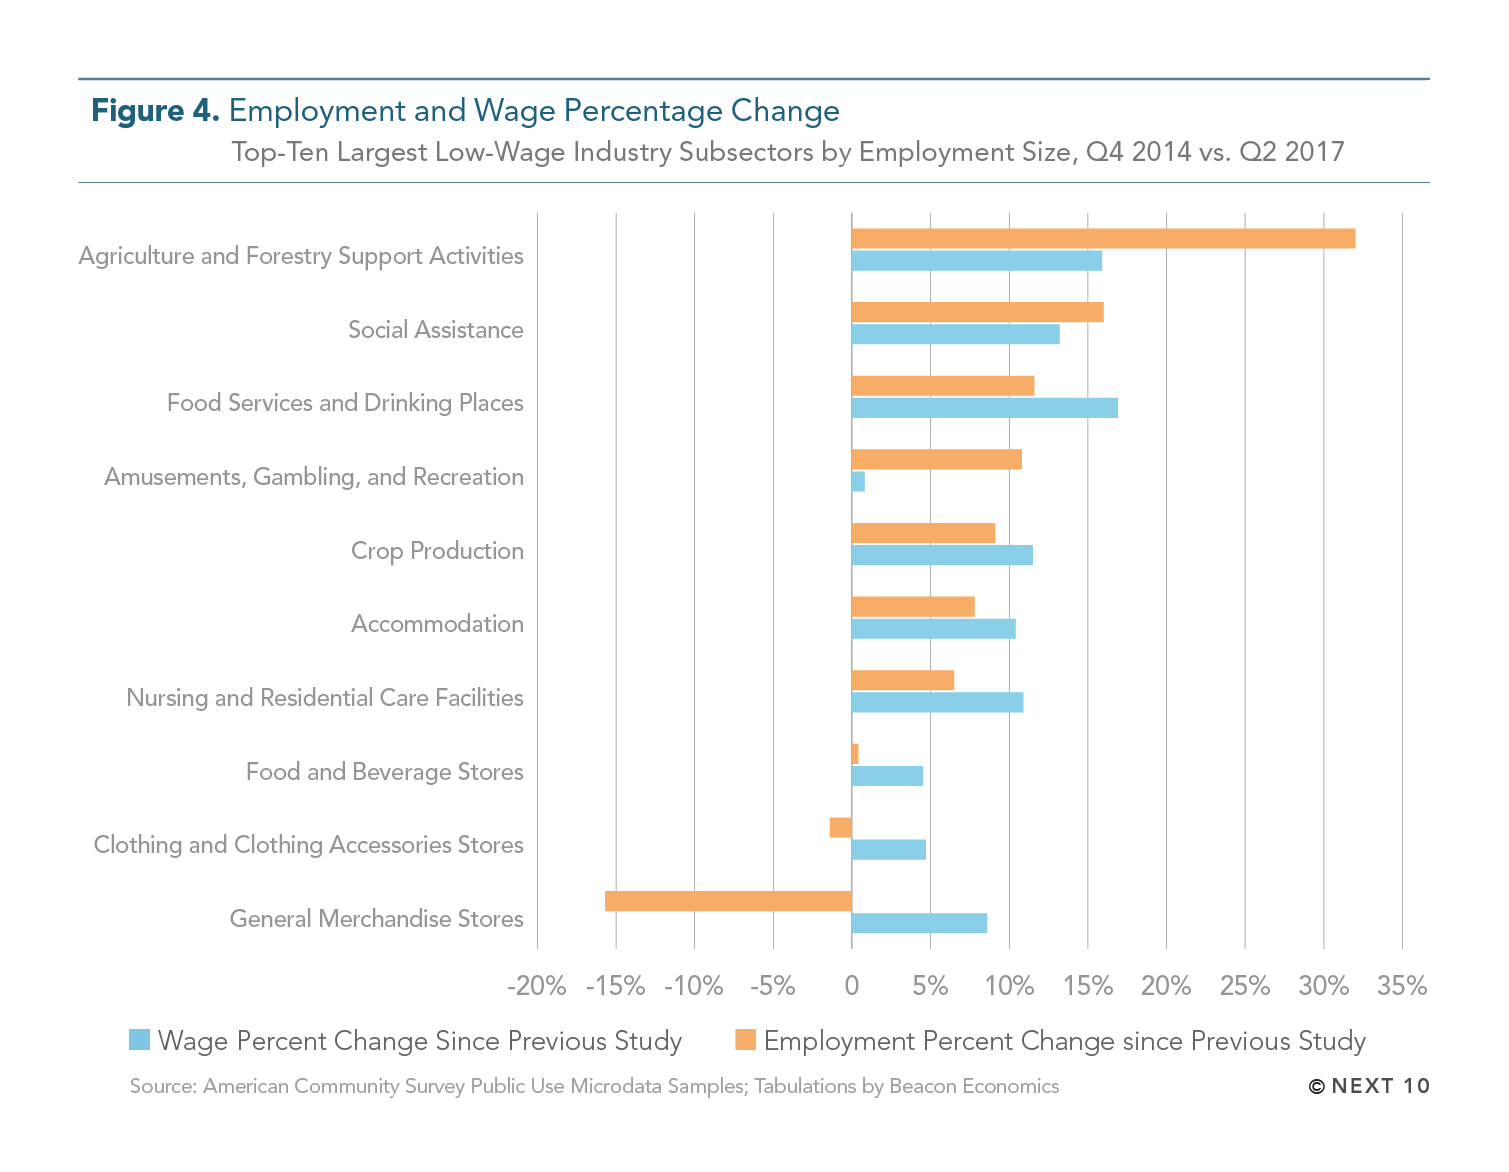
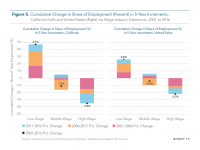
- Jobs in low- and middle-wage industry sub-sectors have been outpacing growth in high-wage subsectors from 2014 through Q2 2017, with 6.8, 6.8 and 4.3 percent growth, respectively.
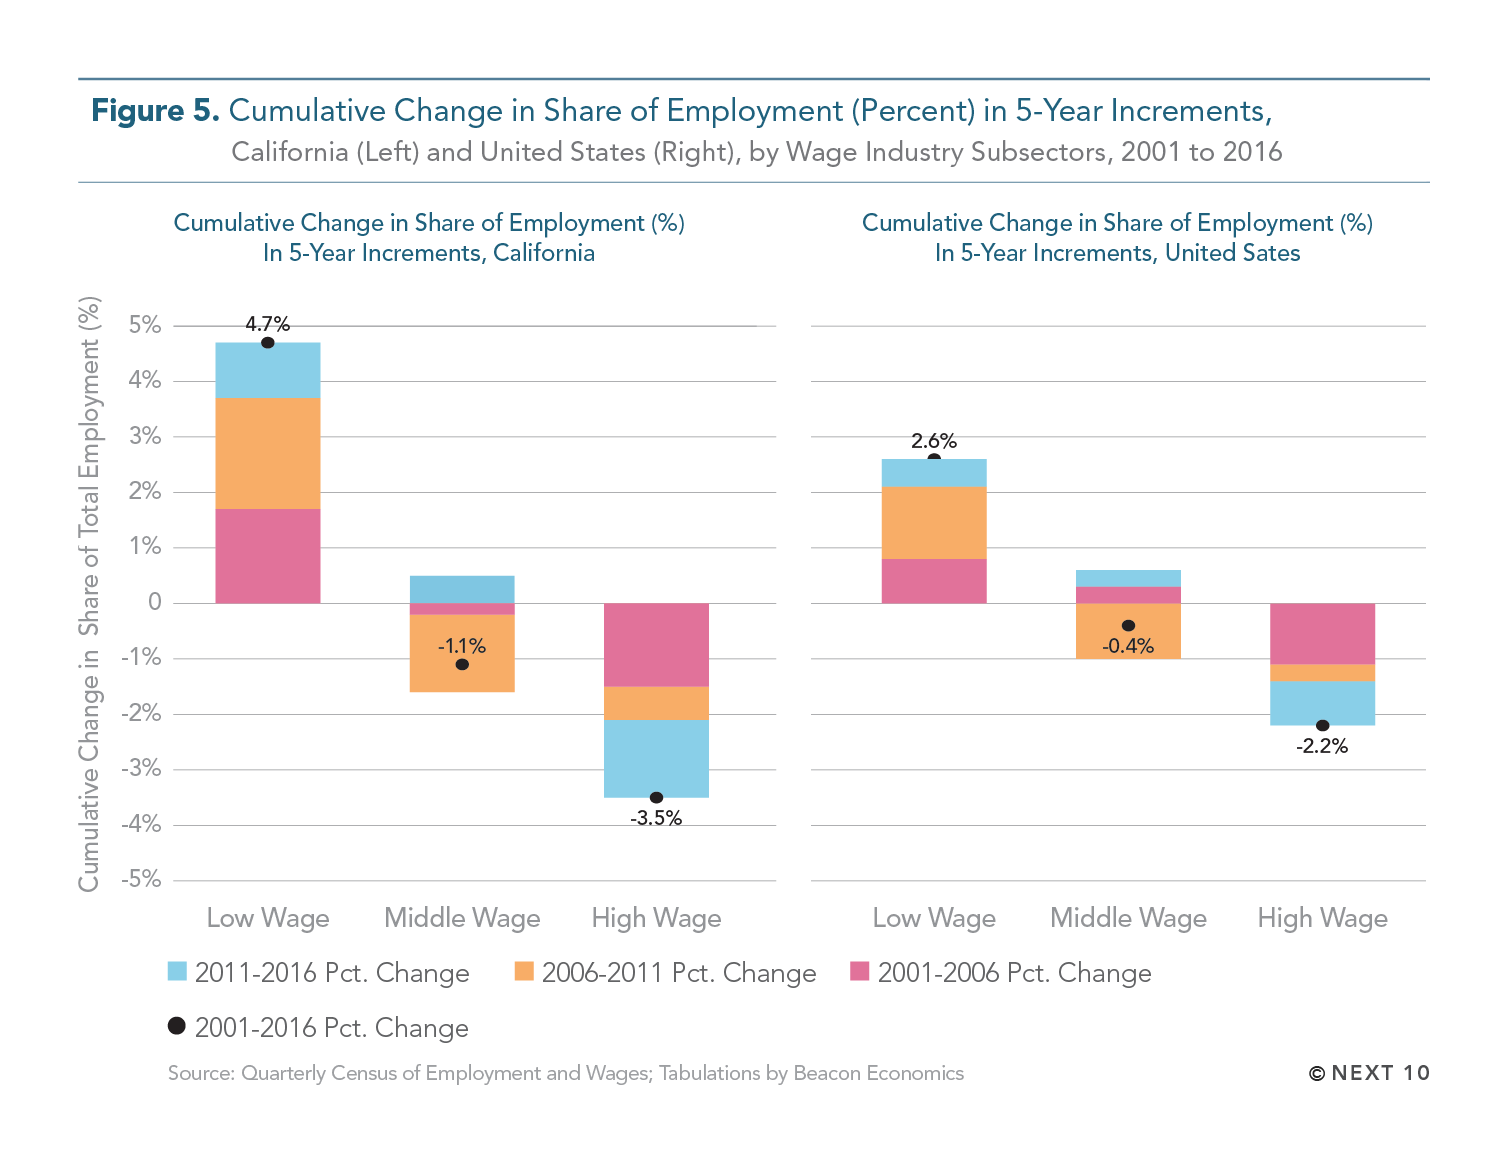
- Low-wage industry growth in California has outpaced similar growth nationwide.
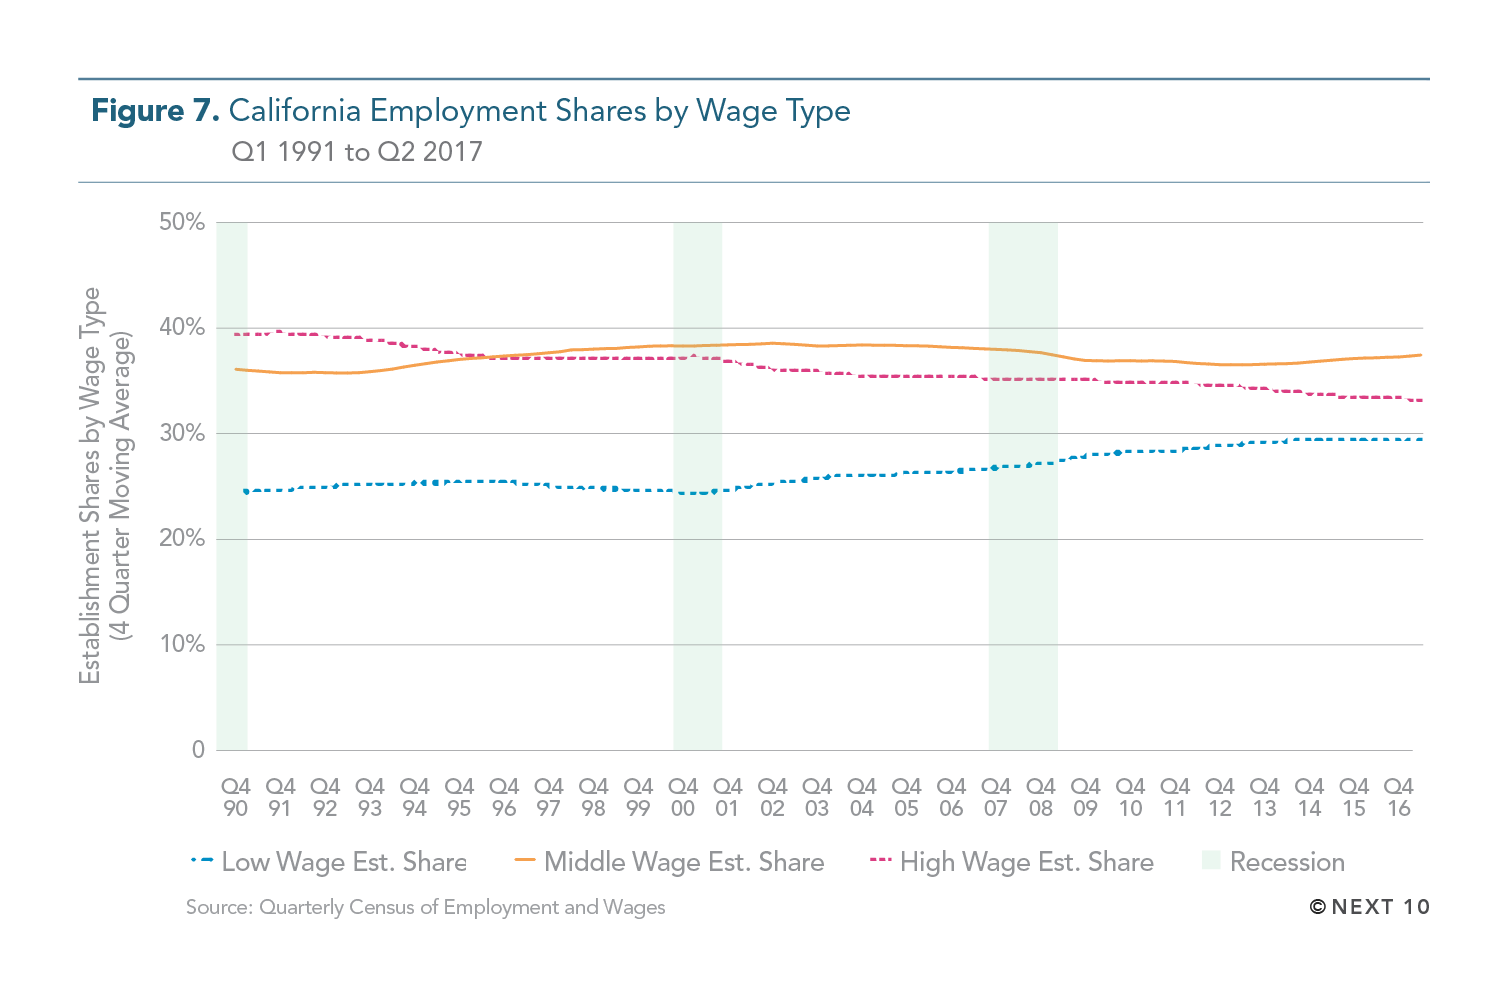
- Statewide, low-wage employment has increased from less than 25 percent of total jobs in 2001 to almost 30 percent in 2016.
- These jobs are concentrated in sub-sectors such as leisure and hospitality, retail, healthcare, and agriculture.
- Statewide, high-wage employment fell from almost 37 percent of workers to 33 percent from 2001 to 2016.
- These jobs are concentrated in sub-sectors such as professional and technical services, hospitals, and building construction.
- California’s growth in the professional and technical services (PTS) sector, inclusive of the state’s booming tech industries, fell from 11th-highest in 2014 to 33rd-highest in 2017—though the state still has the largest total number of employees in this sector, with 13.2 percent of the nation’s PTS jobs.
- Wages in the tech sector are growing more than wages in any other high-wage industry.
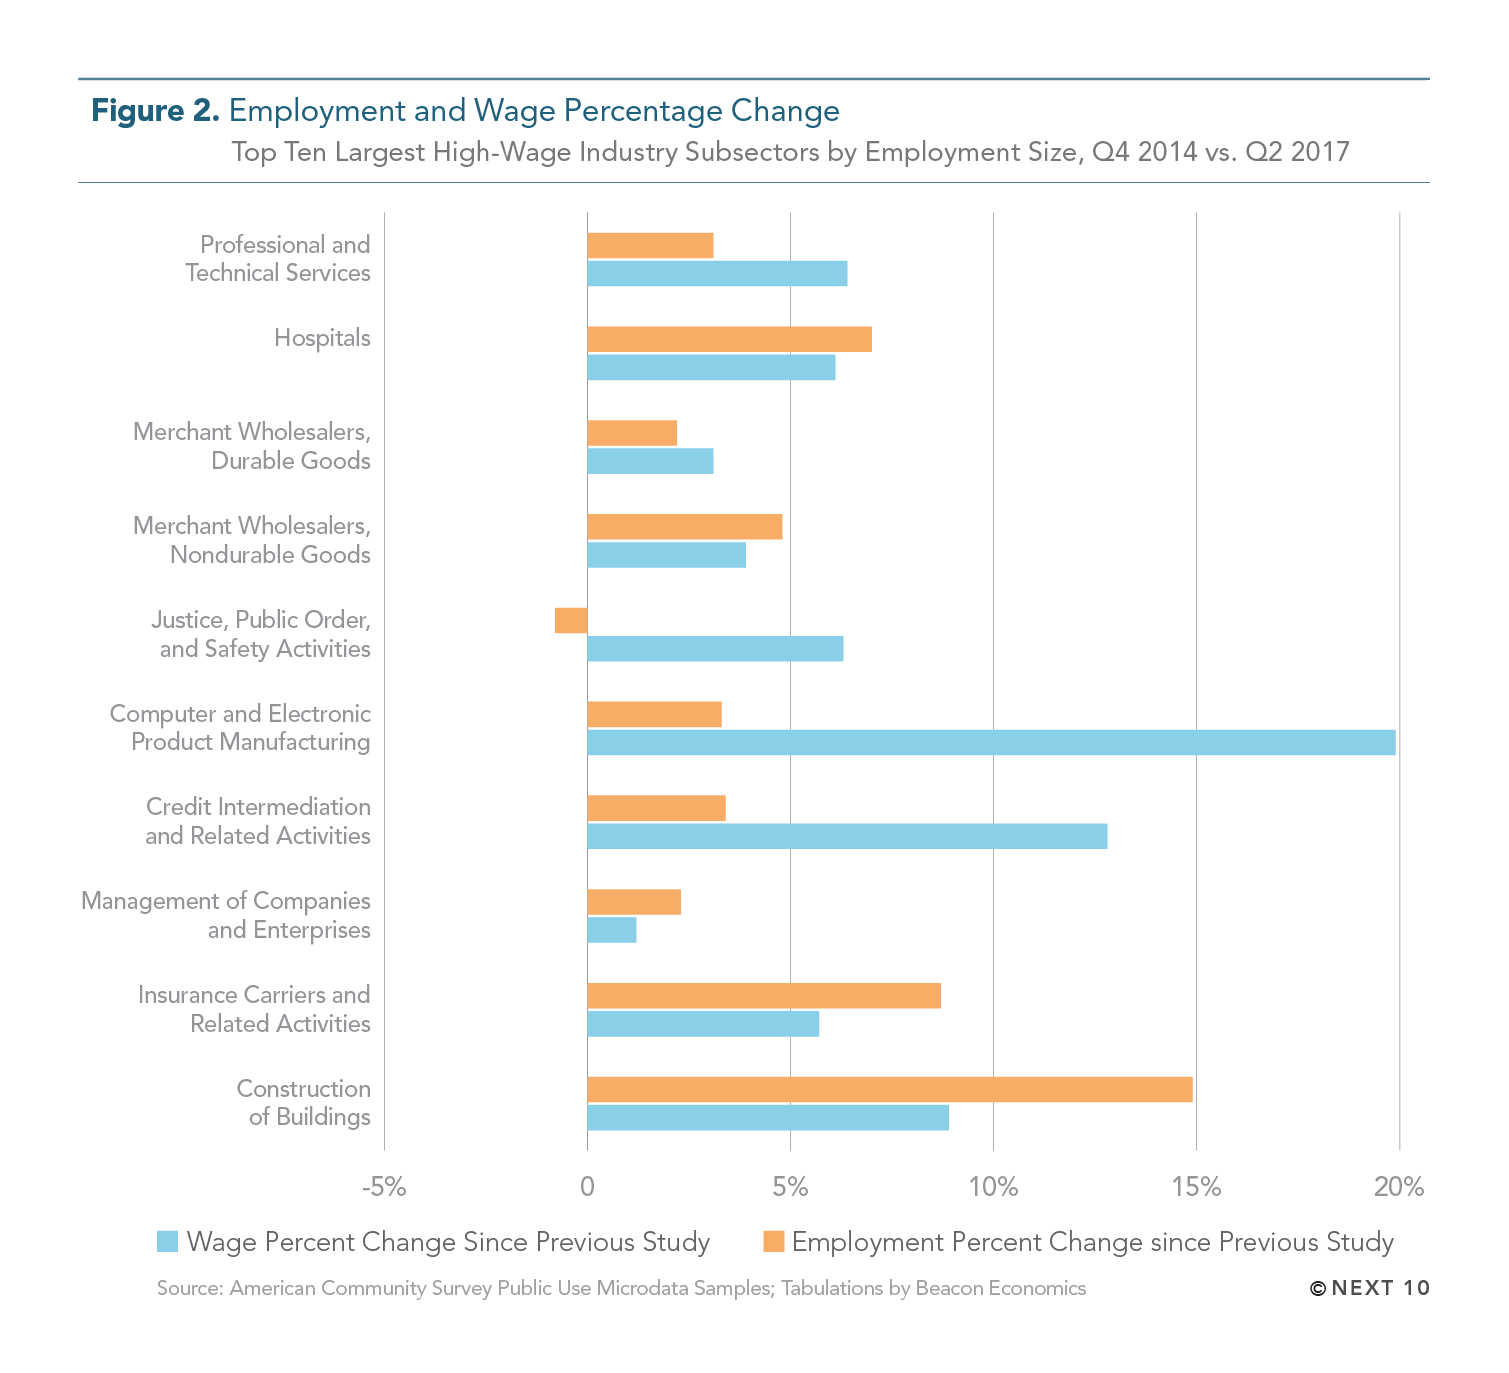
- The computer and electronic product manufacturing subsector has seen the largest increase in wages (19.9% since Q4-2014).
- New development across the state is boosting high-wage jobs.
- Of the top 10 largest high-wage subsectors, the biggest job gains have been in the building construction subsector (14.9% since Q4-2014).
Next 10 owns the copyright to all graphics in this section, and they are available for download and limited use, subject to our Terms of Use. Please contact Next 10 at info@next10.org with any questions.